Ottosson F. International Journal of Cardiology. 2021 Feb;1-15.
The main cause of death and a crucial health concern worldwide is cardiovascular disease (CVD). Dyslipidemia is one of the features of CVD, however is attributed with crude determinants of plasma HDL- and LDL-cholesterol and triglycerides. Lipidomics entitled more detailed assessments of plasma lipids, which may aid enhance risk stratification and understand the pathophysiology of cardiovascular disease. Recognising plasma lipid species is necessary that forecast new-onset coronary artery disease (CAD) because it could aid to refine the view of CAD-associated dyslipidemia in order to discover molecular targets for pharmacological interferences and to enhance risk stratification. Thus, Ottosson F, et al. conducted a study to form a predictive lipid risk score by feature selection least absolute shrinkage and selection operator (LASSO) in Cox proportional hazards models.
A prospective population-based group is the Malmö Diet and Cancer – Cardiovascular Cohort (MDC-CC) was outlined to study the epidemiology of carotid artery disease gathered from 1991 to 1994. All the MDC-CC participants underwent medical history, physical examination, and laboratory and lifestyle evaluation at baseline. 4,067 patients from 5,405 overnight-fasted patients had citrate plasma samples available for evaluation of the lipidome. Samples were distributed into analytical batches of 84 samples each. Each batch was leaded by a set of four blank samples and 8 identical control reference samples (human plasma). 184 lipids in plasma samples from the Malmö Diet and Cancer Cardiovascular Cohort (N=3865) was estimated with the lipidomics. 536 patients developed coronary artery disease (CAD) in an average follow-up time of 20.3 years. Least absolute shrinkage and selection operator (LASSO) were applied to Cox proportional hazards models in order to recognise plasma lipids that forecast CAD.
In total, 8 lipid species, phosphatidylcholine (PC) 15:0;0_18:2;0, PC 17:0;0_20:3;0, PC 16:0;0_20:1;0, PC O 16:2;0_18:0;0, sphingomyelin (SM) 34:1;2, diacylglycerol (DAG) 18:1;0_18:3;0, phosphatidylinositol (PI) 16:0;0_20:4;0 and sterol ester (CE) 18:0;0, assisted to enhanced prediction of incident CAD on top of the traditional CAD risk factors. Systolic blood pressure was the risk factor that showed the largest improvement in c-index (2.0%) than the basic model, pursued by prevalent diabetes (1.3%), smoking (1.0%) and HDL cholesterol (1.0%). PC2 showed most improvement in the prediction (0.9%), followed by PC15:0;0_18:2;0 (0.6%) between lipidomic characteristics (Figure 1).
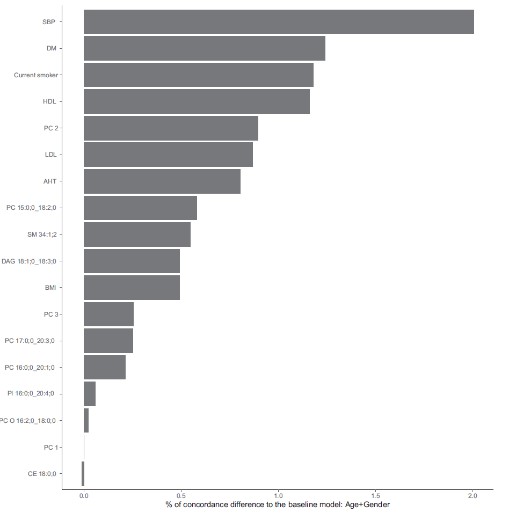
Figure 1: Improvements (%) in concordance-index (c-index) when iteratively adding each variable to a baseline Cox proportional hazards model including age and sex as covariates.
The correlation among all lipidomic characteristics (the three lipid PCs and the eight CAD correlated lipids) and incident CAD was evaluated by Cox regression models, adjusted for all CAD risk factors. PC2 was the most strongly correlated lipidomic feature (HR per SD increment =1.46, CI=1.35-1.48, p<0.001). 3 species, SM 34:1;2, PC 16:0;0_20:1;0 and PC O 16:2;0_18:0;0 were correlated with elevated risk and 4 lipids species, PC 15:0;0_18:2;0, DAG 18:1;0_18:3;0, PI 16:0;0_20:4;0 and CE 18:0;0 were correlated with a reduced risk of incident CAD between the individual lipids (Figure 2).

Figure 2: Associations between lipid measurements and incident CAD. Hazard ratios (HR) are expressed per standard deviation increment of the lipid. Error bars indicate the 95% confidence intervals of the HR. Associations were considered significant at p < 0.05. Principal components are denoted as PC1-PC3.
Triglycerides and total cholesterol did not affect the correlations in additional adjustment for lipid-lowering treatment. Being in the top quartile of PC2 was correlated with a more than doubled risk of generating CAD than the lowest quartile (HR=2.33, CI=1.81-3.00, p<0.001). Adding PC2 on top of traditional risk factors achieved a statistically substantial enhancement (2%) in the AUC for incident CAD incidents happening within 10 (p=0.03), 15 (p=0.003) and 20 (p=0.001) years respectively (Figure 3)
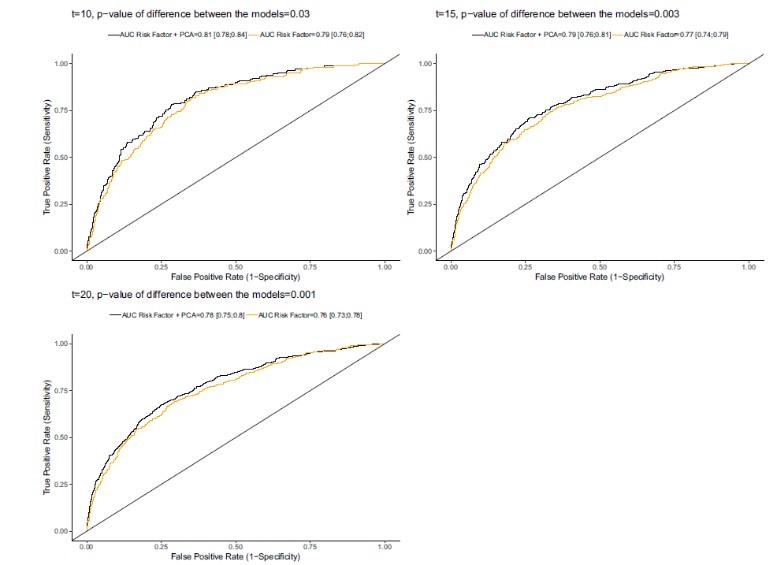
Figure 3: Receiver operating characteristic (ROC) curves for prediction of future CAD, censored at three different follow-up times (10 years, 15 years and 20 years). The area under the curve (AUC) is calculated for two different models at each time point, where the first model (AUC Risk Factor) includes nine traditional CVD risk factors (age, sex, BMI, HDL cholesterol, LDL cholesterol, systolic blood pressure, smoking, anti-hypertensive treatment and diabetes) and the second model (AUC Risk Factor + PCA) additionally include the CVD-predictive lipidomics principal component (PC2). The 95% confidence interval for each AUC are given in brackets. P-values for model differences in AUC at each censoring time are calculated using the Wald test.
Thus, it was concluded that a lipid pattern enhances CAD prediction above traditional risk factors, highlighting that conventional lipid-measures inadequately explain dyslipidemia that is present years before CAD. Recognising this hidden dyslipidemia may aid motivate lifestyle and pharmacological interventions early enough to reach a significant decrease in absolute risk.