Sending the Right Signals – How Exercise Keeps the Rhythm in Metabolism
Zierath JR, Professor and Executive Director (Novo Nordic Foundation Centre for Basic Metabolic Research, Faculty of Health and Medical Sciences, University of Copenhagen), was awarded the 2021 Claude Bernard award. The Claude Bernard award is EASD’s highest award in recognition of an individual’s innovative leadership and lifetime achievements in diabetes research. She presented a session on “Sending the right signals – How exercise keeps the rhythm in metabolism” at the Virtual EASD Annual Meeting 2021 on 28th September 2021.
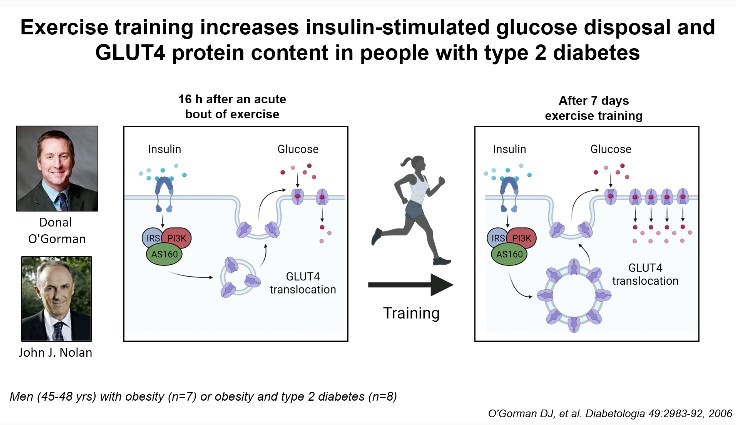
She touched upon various topics relating to exercise biology – the ultimate integrative physiology; signals controlling skeletal muscle insulin sensitivity; exercise and training as treatment for insulin resistance; molecular basis of exercise induced adaptations; and fine tuning exercise prescription for maximal benefits. It has been known that gene-environment interactions regulate the disease risk of diabetes and obesity. Multiple organ systems are affected by exercise, initiating diverse homeostatic response. Exercise elicits a state of high energy demand and stimulates multiple bodily functions to maintain energetic homeostasis. Translational processing and an elevated rate of post-exercise protein synthesis result in a modest, same-directional change in protein content. The training-induced phenotypic adaptation is the consequence of repetition of the stimulus of individual exercise bout, leading to a new functional threshold. Exercise training increases insulin-stimulated glucose disposal and GLUT4 protein content in people with type 2 diabetes. Acute exercise remodels DNA methylation in skeletal muscle. In a meta-analysis, it was identified that NR4A3 was the most exercise and inactivity responsive genes and a differential response to exercise exists in individuals with metabolic impairments. The time of exercise or dietary intervention specifies the rewiring of metabolic pathways and systemic energy homeostasis. In humans, mitochondrial oxidative capacity and lipolysis display circadian patterns in peripheral organs, and disturbance of rhythms may be implicated in the development of metabolic disorders. Indeed, circadian desynchronise has an impact on food intake, insulin sensitivity, and the risk of developing metabolic illness. Time-targeted methods, which attempt to synchronize external signals with the biological clock to optimize metabolic outcomes, have been shown in studies to increase body weight reduction and glucose tolerance.
It is important to dissect the mechanisms controlling the acute response to exercise, as well as adaptive response to training. Understanding molecular mechanism by which different modes of exercise independently and concurrently improve glucose metabolism and muscle function in people with type 2 diabetes should be taken in consideration. Such approaches should be tempered with the understanding that there is large heterogeneity in the adaptive response to exercise training.
An Homage to 100 Years of Insulin Therapy: What Has Been Achieved Regarding Cardiovascular Complications?
Valensi P, presented a session on “An homage to 100 years of insulin therapy: What has been achieved regarding cardiovascular complications?” at the Virtual EASD Annual Meeting 2021 on 28th September 2021.
Insulin has completed the journey of one-century. Till today, insulin works wonderfully and has managed to save lives. Several innovations in the insulin type, formulations, ways of administration, combination therapies, diabetes care management have been taken place over the years. Insulin may impact the cardiovascular prognosis. Insulin has been known to induce favorable effects such as vasodilation, platelet inhibition, anti-oxidant, anti-inflammatory, anti-thrombotic, anti-atherosclerotic, and profibrinolytic.
However, a higher proportion of patients on insulin at inclusion were hospitalized for HF vs among those who were not was seen in the SAVOR trial. In the DIGAMI 2 trial, when three glucose management strategies were compared no benefits nor harm of insulin was observed in the outcomes of mortality and composite CV endpoints like death, stroke or second myocardial infarction. In the ORIGIN trial, insulin glargine when used early in the course of diabetes for more than 6 years, showed a neutral effect on cardiovascular outcomes and cancers. Although it reduced new-onset diabetes, insulin glargine also increased hypoglycemia and modestly increased weight. In the HEART 2D trial, treating diabetic survivors of AMI with prandial versus basal strategies achieved differences in fasting blood glucose, less-than-expected differences in postprandial blood glucose, similar levels of HbA1c, and no difference in risk for future cardiovascular event rates.
In the secondary analysis of the DEVOTE trial, patients receiving insulin glargine and insulin degludec prior heart failure was the strongest predictor of future hospitalization for heart failure (hHF) events, and there was an association between severe hypoglycemia and subsequent HHF.
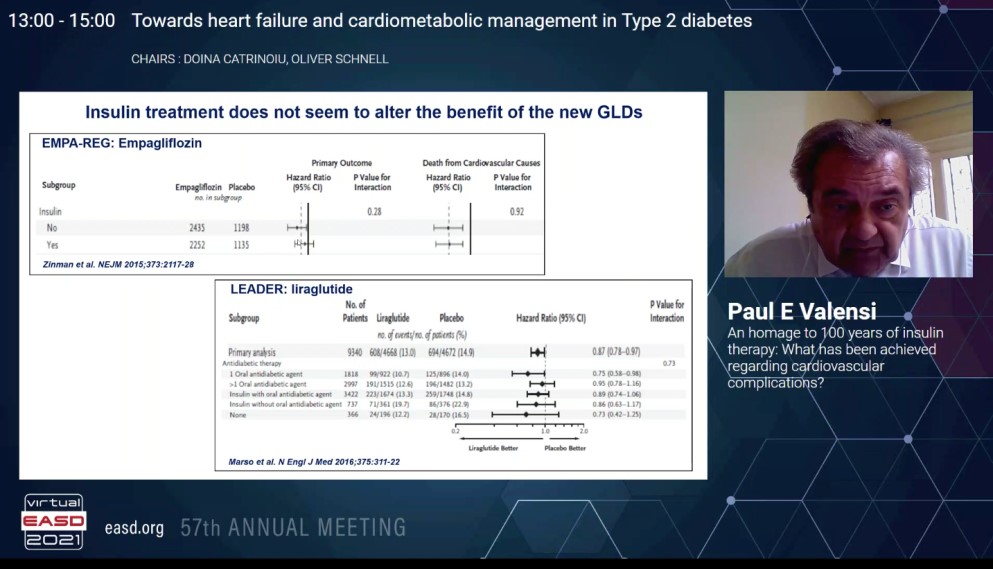
In landmark trials like EMPA-REG outcome and LEADER the background use of insulin does not seem to alter the effects of new glucose lowering drugs like empagliflozin and liraglutide respectively. In the FLAT-SUGAR proof of concept study, a glucacon-like peptide-1 receptor agonist and insulin based regimen reduced glycemic variability, weight, and some cardiometabolic risk markers while maintaining equivalent HbA1c levels versus basal bolus insulin.
The new challenges for insulin treatment would be to reduce the risk of hypoglycemia and lower the glucose variability a mandatory outcome in patients with heart disease with new insulins and new glucose monitoring devices with closed loop systems. Though it was seen that insulin does not alter the beneficial effects of the new glucose lowering drugs, there is a need for other cardiovascular outcome trials assessing the safety and efficacy of insulin.
Diabetes Remission Through Insulin Secretion by Islet Non-Beta Cells
Herrea P, presented a session on “Diabetes remission through insulin secretion by islet non-beta cells” at the Virtual EASD Annual Meeting 2021 on 28th September 2021.
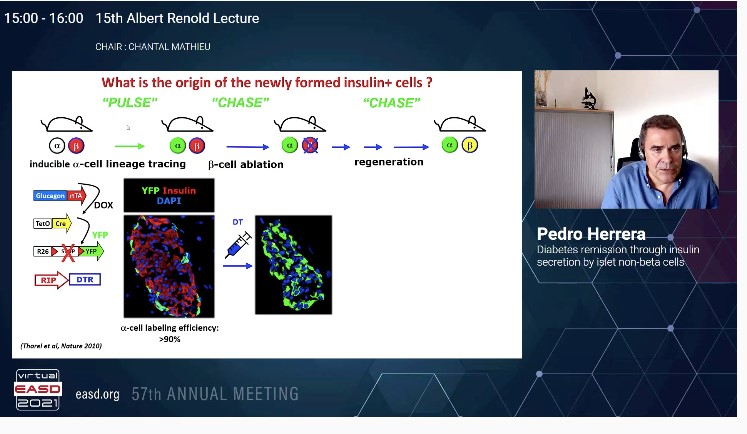
It is important to understand the origin of insulin producing pancreatic β-cells during normal embryonic development and during regeneration in diabetes. The question to answer is do all islet cell types arise from a common precursor, α-like expressing glucagon.
In a study, the first use of Cre/laxP system to mark cells in the body in order to follow their fate and progeny was done. A method to irreversibly mark cells in the body via cell-type specific gene activation was done. The α and β-cell lineages arise independently during ontogeny, from a common precursor expressing insulin promoter factor 1 (PDX1). Early PDX1+ cells are pancreas progenitor cells, early Neurog3-expressing (NGN3+) cells are islet progenitor cells and early NESTIN+ cells are exocrine progenitors. NGN3+cells as a stem progenitor cells are multipotent gives rise to α, β, ϒ cells; whereas NGN3+ committed precursor cells ae unipotent. Thus NEUROG3+ cells are post mitotic committed unipotent late precursors where each single NEUROG3+ cells become one islet cell at birth. These islet cells have a very low proliferation rates.
In regeneration studies conducted in transgenic mice and adults, it was observed:
- The juvenile adult and aged mammalian pancreas spontaneously regenerates insulin producing cells when β-cells are massively lost.
- In this extreme situation, the new insulin producing cells in adult mice are reprogrammed islets non-β cells that are transiently bihormonal.
Intra-islet signalling acts as a constitutive brake restricting α-cell plasticity. In tissular homeostasis – cell identity maintenance is an active process mediated by repressive signals curbing intrinsic trend of cells to change. The human glucagon-expressing α-cells can start insulin production and glucose dependent insulin secretion in appropriate conditions.
The future directions involve combining mouse and human studies. The use of systems/bioinformatics/epigenetics approaches to explore the facultative induction of the adaptive functional cell plasticity should be explored. Pharmacology and delivery tools to exploit plasticity to modelling disease (should α/β hybrid cells be generated instead of perfect β-cells); to assess the contribution of α, δ, ϒ, and to β-cell function and to screen for regulators of proliferation and reprogramming in human islet non-βcells in vitro.
Personalising the Treatment for Patients with Type 2 Diabetes: The Mean is Meaningless
Lambers HH, presented a session on “Personalising the treatment for patients with type 2 diabetes: the mean is meaningless” at the Virtual EASD Annual Meeting 2021 on 28th September 2021.
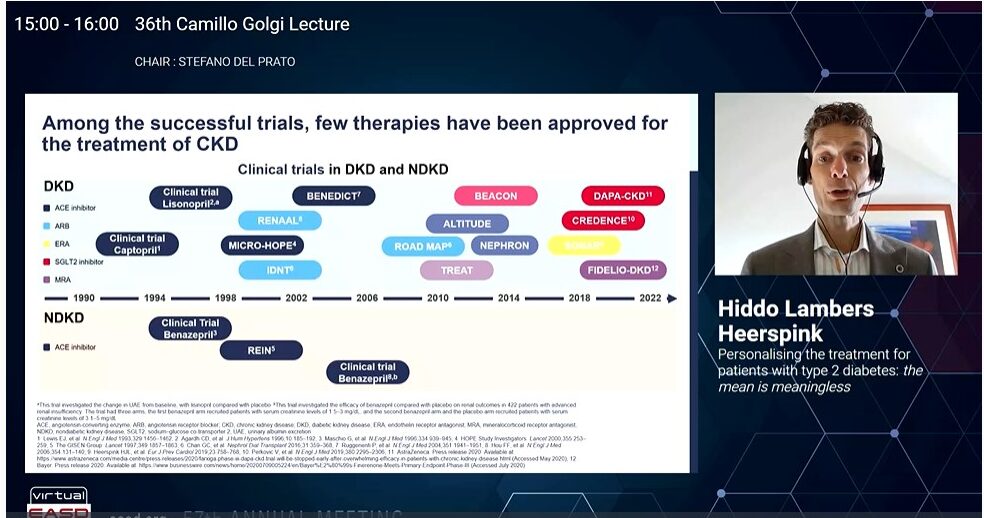
Landmark trials like DAPA-CKD and CREDENCE demonstrated that though SGLT2 inhibitors reduced the risk of kidney failure but still the residual risk persists. The CREDENCE trial showed that canagliflozin reduces heart failure hospitalisation or Cardiovascular death in patients with diabetic kidney disease. In the SONAR trial use of Atrasentan (endothelin receptor antagonist) reduced the risk of renal events in patients with diabetes and chronic kidney disease who were selected to optimise efficacy and safety, however it increased the risk of heart failure events. In patients with chronic kidney disease (CKD) and type 2 diabetes, treatment with finerenone resulted in lower risks of CKD progression and cardiovascular events than placebo as per the FIDELIO-DKD trial. However, the residual risk remained high in these patients.
High risk is explained by suboptimal individual drug response where the ultimate good responder is protected against kidney failure and heart failure. Progression of cardio-renal complications is often slow and takes too long to monitor drug response. Biomarkers like elevated blood pressure and presence of albuminuria is used to monitor drug response to anti-hypertensives and kidney protective drugs.
The ROTATE study is a multicentre, open-label randomised 5-period cross over study whose primary objective is to study correlation in drug response of drugs like telmisartan, linagliptin, empagliflozin, baricitinib. Patients with type 1 and type 2 diabetes with urine albumin creatinine ratio (UACR) 30-500 mg/g and estimated glomerular filtration rate (eGFR) >45 mL/min/1.73m2 were enrolled. This is an ongoing study.
SGLT2 inhibitors decrease albuminuria with large between individual variation. SGLT2 inhibitors also reduce the risk of hyperkalaemia. Endothelin A receptor antagonists (ERAs) decrease residual albuminuria in patients with diabetic kidney disease; however, their clinical utility may be limited by fluid retention SGLT2 inhibition abrogates ERA induced fluid retention. GLP-1 RA and SGLT2 inhibitor combination reduces albuminuria more than either therapy alone.
SGLT2 inhibitors + GLP-1 RA should be used in obese individual with HbA1c of 9.1%, eGFR of 46 ml/min and UACR of 52 mg/mmol. SGLT2 inhibitors + MRA should be used in individuals with NTproBNP levels of 850 pg/mL, NYHA class III heart failure, HbA1c of 7.1%, eGFR of 53 ml/min, UACR of 109 mg/mmol and BMI of 19 kg/m2. SGLT2 inhibitors plus ERA should be used in individuals with potassium levels of 5.8, eGFR of 46 ml/min and UACR of 52 mg/mmol.
Pathophysiological Changes During Weight-loss Induced Remission of Type 2 Diabetes in Non-obese People

Categorisation of people as per the BMI leads to the common assumption that weight loss is not designated in non-obese individuals with type 2 diabetes. Al-Mrabeh A, presented a study in a session at Virtual EASD Annual Meeting 2021 on 28th September 2021 which analysed the pathophysiological changes in weight loss induced remission of type 2 diabetes in people with BMI <27kg/m2.
25 people were studied to date, 2/25 were shown to have MODY/ type 1 diabetes and were excluded [type 2 diabetes: n=12, age 58.3±7.2 years, BMI 24.5±2.0kg/m2, diabetes duration 2.5±2.2years; non-diabetic controls: n=11, age 58.8±9.5 years, BMI 21.6±2.5kg/m2]. Controls were age, sex and BMI-matched (following weight loss) to the type 2 diabetes group and were examined on a single occasion. A low-calorie diet (~800 kcal/day) were given to achieve dietary weight loss followed by 4-6 weeks of weight stability. The cycle of weight loss plus maintenance was repeated 2-3 times (10-15% weight loss) till the clinical end point of remission was accomplished (HbA1c < 48mmol/mol). Intraorgan fat was measured using 3-point Dixon magnetic resonance. Indices of insulin sensitivity (SI) and beta cell responsivity (Φtot) following a standard meal were measured using mathematical modelling.
Fasting plasma glucose and HbA1c were reduced (7.3±0.3 to 6.3±0.3 mmol/l, and 53.8±2.1 to 48.0±1.5 mmol/mol, respectively, p<0.05 for both) following weight loss (Table 1). Fasting plasma insulin was normalised (52.2±9.5 to 23.7±3.6 pmol/L, p=0.007). Total body fat was reduced (33.1±1.9 to 27.4±2.0%, p<0.001) as did plasma triglyceride (1.6±0.2 to 1.0±0.1mmol/L, p=0.002) with no changes in NEFA (0.67±0.04 to 0.68±0.07mmol/L, p=0.98). Liver fat at baseline was over twice that of controls (4.4±0.8 vs. 1.9±0.3%, p=0.02), and associated negatively with HDL (r=-0.78, p=0.003). It reduced following intervention (1.4±0.1%, p=0.004 vs. baseline) becoming similar to the control levels. Pancreas fat dropped (5.1± 0.6 to 4.5±0.6%, p=0.026) towards control levels (3.4±0.3%, p=0.13). Post meal SI, Φtot, and disposition index (DI) was enhance following weight loss. Weight loss persuaded remission (HbA1c <48mmol/mol off medication) was accomplished in 67% (8/12) intervention participants.
2/14 people diagnosed with type 2 diabetes in this BMI range showed other diagnoses. In overweight or obese individuals with type 2 diabetes, remission and return of beta cell function with fall in liver and intrapancreatic fat content were noticed in a similar proportion to previous studies. Non-obese people with type 2 diabetes exhibit similar pathophysiological changes in the remission of diabetes.
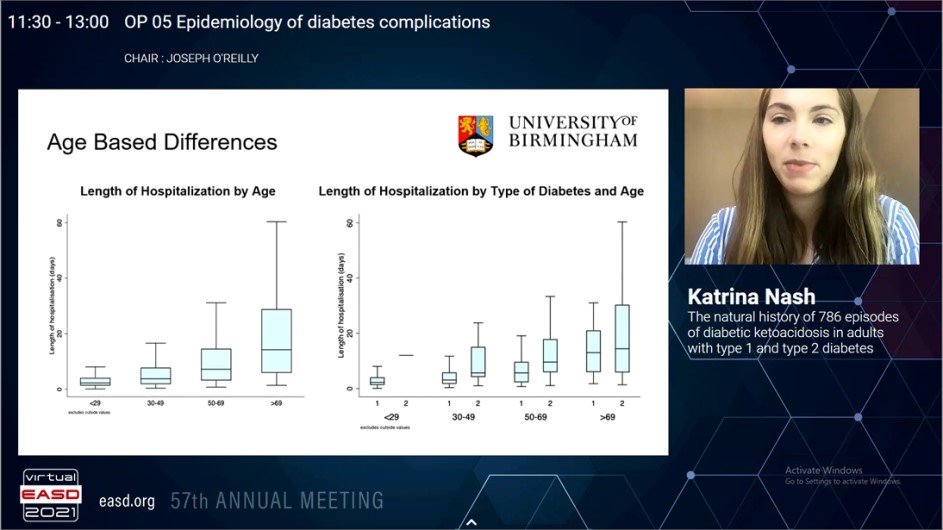
The Natural History of 786 Episodes of Diabetic Ketoacidosis in Adults with Type 1 and Type 2 Diabetes
Although diabetic ketoacidosis is traditionally correlated with type 1 diabetes, it is increasingly identified that people with type 2 diabetes can also progress this condition. Recently, the evidence studying the differences among these groups is very limited. Nash K, presented a study in a session at Virtual EASD Annual Meeting 2021 on 28th September 2021 which aimed to investigate the differences in the demographics, presentation and treatment of diabetic ketoacidosis in adults with type 1 diabetes and type 2 diabetes.
This group study incorporated all episodes of diabetic ketoacidosis from April 2014 to September 2020 in a tertiary centre in the United Kingdom. Diabetes was categorised into type 1 diabetes and type 2 diabetes according to previously established diagnoses, autoantibody status, and/or phenotypic attributes. Data were gathered for diabetes type, demographics, biochemical and clinical features at presentation and treatment of diabetic ketoacidosis. As data were altered, Wilcoxon sum rank test was applied to compare the two groups on different variables.
583 (75.9%) type 1 diabetes and 185 (24.1%) type 2 diabetes episodes from 786 consecutive diabetic ketoacidosis episodes, were incorporated in the final evaluation. The median (IQR) age for altogether group was 38.2 years (23.8-56.8) with male: female ratio of 1:1.04. People with type 2 diabetes were older (type 1 diabetes: 28.97 years [21.9 – 48.7] vs type 2 diabetes 61.54 years [52.0-75.1]; p<0.0001) and showed more ethnic minority representations as compared to patients with type 1 diabetes (non-white: type 1 diabetes 19.7% vs type 2 diabetes 26.5%; p=0.030). Intercurrent illness (35.4%) was the most frequent precipitating causes for diabetic ketoacidosis in both groups. pH evaluated the severity of diabetic ketoacidosis (type 1 diabetes 7.22 [7.09-7.29] vs type 2 diabetes 7.24 [7.11-7.30]; p=0.3266).In both groups, glucose (type 1 diabetes 28.0 mmol/l [20.5-34.8] vs type 2 diabetes 13.2 mmol/l [7.8-17.8]; p=0.4496) and lactate (type 1 diabetes 2.6 mmol/l [1.8-4.3] vs type 2 diabetes 2.6 mmol/l [2.0-4.2]; p=0.6532) was similar at presentation. But, patients with type 2 diabetes had higher urea (type 1 diabetes 7.1 mmol/l [5.1-10.6] vs type 2 diabetes 8.9 mmol/l [6.4- 16.8]; p=0.0001). Insulin requirements (type 1 diabetes 91.6 units [43.5 – 143.9] vs type 2 diabetes 90.2 units [53.6 – 157.4]; p=0.5551) and total duration of diabetic ketoacidosis (type 1 diabetes 13.9 hours [9.1-21.9] vs type 2 diabetes 13.9 hours [7.7-21.1]; p=0.4638) were similar among the two groups. People with type 2 diabetes showed longer hospital stay (type 1 diabetes 3.0 days [1.7-6.1] vs type 2 diabetes 11.0 days [5.0-23.1]; p<0.0001).
A quarter of diabetic ketoacidosis episodes happen in people with type 2 diabetes who were older and with higher ethnic minorities proportion than type 1 diabetes. But, both groups showed similar extremity of presentation and treatment recommending that the same protocol is equally efficacious in either type of diabetes. People with type 2 diabetes admitted with diabetic ketoacidosis have a prolonged hospital admission, may be reflecting a more complex requirement of care.
High Adherence to Recommended Diabetes Follow-up Procedures by General Practitioners is Associated with Lower Estimated Cardiovascular Risk

The association among diabetes quality indicators and diabetes outcomes is unclear. Nøkleby K, presented a study in a session at Virtual EASD Annual Meeting 2021 on 28th September 2021 which aims to investigate whether general practitioners’ (GPs’) performance of recommended activities of care were correlated with estimated risk of cardiovascular disease (CVD) and poor glycaemic control in their type 2 diabetes patients.
6015 people with type 2 diabetes <75 years old, without CVD and their 275 GPs were incorporated in a cross-sectional study from Norwegian general practices. The GPs were divide into quintiles based on each GP’s average performance of six recommended processes of care (estimations of HbA1c, LDL-cholesterol, albuminuria, blood pressure and foot examination the past 15 months; and recorded eye analysis the past 30 months). The risk calculator NORRISK 2 was used to measure the 10-year risk of cardiovascular events. The main outcome was the modifiable fraction of estimated CVD riskto avoid excessive confounding of strong non-modifiable risk factors. The exposure variable were the quintiles of GPs in multilevel regression models with estimated CVD risk (total and modifiable fraction) and poor glycaemic control; HbA1c >69 mmol/mol (>8.5%) being outcome variables.
The mean total and modifiable estimated 10-year CVD risk was 12.3% and 3.3% respectively. Between persons registered with GPs in the lowest (13.5%) and the highest (11.3%) quintile for the performance of procedures exhibited a difference of 2.2% pointsin the mean estimated 10-year risk of CVD. Adjusted for confounders, those belonging to GPs in the lowest quintile showed a 1.88 (1.17 – 2.60) % point higher total CVD risk, representing a relative difference of 16.6% greater average risk between patients in quintile 1 than quintile 5. Patients registered with GPs in the lowest (4.22%) showed almost 2% points greater mean modifiable CVD risk than the highest quintile (2.30%). Following adjusting for confounders, as registered with a GP in the lowest quintile was independently correlated with a 1.78 (1.14 – 2.41, p<0.001) % point higher modifiable CVD risk than those of GPs in the highest quintile. This shows a relative difference of 74.8% (59.0 – 85.8) higher average modifiable risk fraction between those in quintile 1 than quintile 5. In the lowest quintile, 14.1% of the people showed HbA1c above 69mmol/mol (8.5%), than 7.8% in the highest quintile. Patients with GPs in the lowest-performing quintile showed 1.77 (1.27 – 2.46) times higher the adjusted odds of poor glycaemic control than patients with a GP in the highest quintile.
Patients of GPs exhibited a pattern of lower CVD risk and better glycemic control executing more recommended diabetes processes of care.
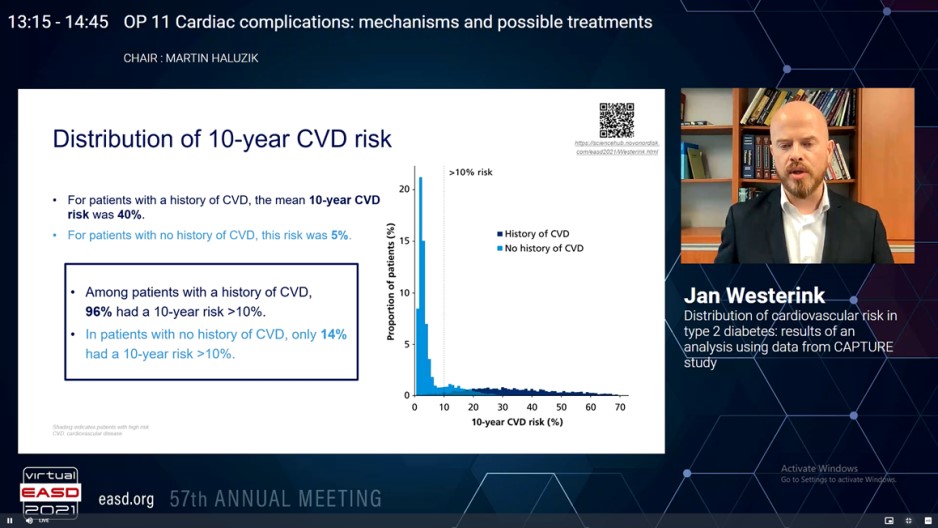
Distribution of Cardiovascular Risk in Type 2 Diabetes: Results of an Analysis Using Data from CAPTURE Study
Cardiovascular disease (CVD) is the prime cause of mortality in type 2 diabetes (T2D). CAPTURE, a non-interventional, cross-sectional study gathered demographic and clinical data in almost 10,000 adults with T2Dover 13 countries in 2019. Less than 25% of patients with established CVD managed with a glucose-lowering agent acquired an agent with exhibited advantage in decrease in CV risk. Westerink J, presented a study in a session at Virtual EASD Annual Meeting 2021 on 28th September 2021 which analysed CV risk distribution in the CAPTURE population, and to evaluate therapy patterns with CV risk with the Diabetes Lifetime-perspective prediction (DIAL) competing risk adjusted model. The model measures absolute 10-year and lifetime risk of myocardial infarction, stroke or cardiovascular death, and life-expectancy free of a CVD incident.
Patient-level data (age, sex, body mass index, smoking status, HbA1c, CVD history, T2D duration, clinical variables and therapy history) from CAPTURE were utilized in the DIAL model; missing data were assigned by region. High risk was described as 10-year risk > 10%, and lifetime risk > 50%.
Data of 9457 patients with T2D aged 30-85 years were incorporated. There was a wide distribution of 10-year and lifetime risk, with greater risk in patients with a history of CVD (n = 2914) as compared to those without (n = 6543). Between patients with a history of CVD, 96% showed a 10-year risk of CVD > 10% and 81% showed a lifetime risk of CVD > 50% (Figure). From patients with CVD and a high 10-year risk of recurrent CVD, 81% showed a lifetime risk of recurrent CVD > 50%. In patients with no history of CVD, 14% showed a 10-year risk > 10% and only 1% showed a lifetime risk > 50% (Figure). In patients with no previous CVD however a high 10-year risk of CVD, only 4% showed a lifetime risk > 50%. From the patients with CVD, 10% acquired a glucagon-like peptide-1 receptor agonist (GLP-1 RA) and 18% received a sodium-glucose co-transporter-2 inhibitor (SGLT-2i); of patients with CVD and a high 10-year risk of recurrent CVD, 10% received a GLP-1 RA and 17% received an SGLT-2i. In patients with no CVD, 11% received a GLP-1 RA and 16% received an SGLT-2i; of patients without current CVD however a high 10-year risk of CVD, 12% received a GLP-1 RA and 16% received an SGLT-2i.
In the CAPTURE population, there is a broad distribution of CVD risk, and only a minority of patients at high risk of CVD acquired a glucose-lowering agent with exhibited advantage in CV risk reduction. Considering these risks and the CV advantage to be received from interventions with patients can improve shared decision-making.
Do Cardiovascular Risk Prediction Models Developed in Primary Care Patients with Type 2 Diabetes Perform Better than the General Population Models? PREDICT Cohort Study
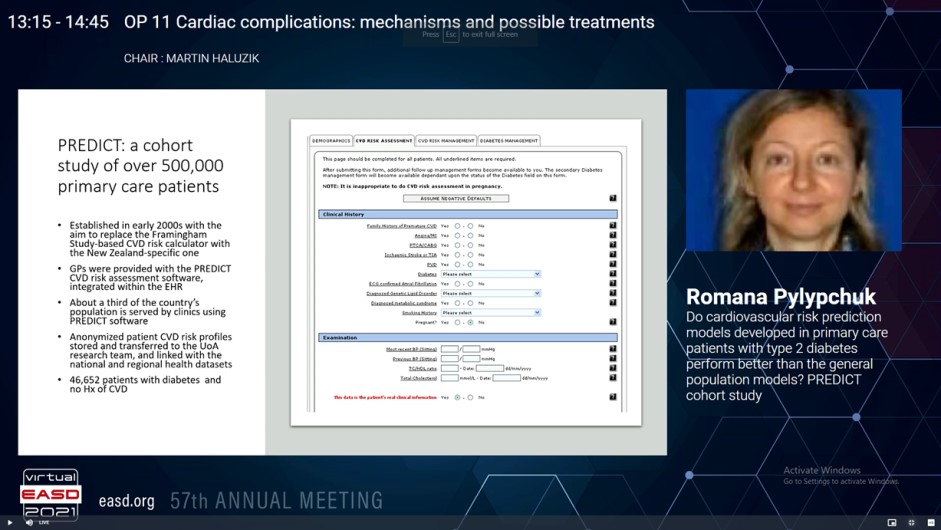
There evidence that cardiovascular risk scores developed particularly in patients with diabetes measure CVD risk more precisely is limited. The predictive ability of CVD risk scores developed in diabetic populations exhibited that their performance differed significantly as compared to those developed in general populations. But, comparing models developed from different studies is problematic because of between-study difference in procedures and differences in populations’ background risk. Pylypchuk R, presented a study in a session at Virtual EASD Annual Meeting 2021 on 28th September 2021 which compared models derived from the same patient population, by a standard set of performance measures, hence resulting in a more valid comparison than has been possible previously in large number of patients with diabetes in the PREDICT group.
A data from the PREDICT primary care cohort of 401,752 CVD-free patients aged 30 to 74 years were used in the study. General population and diabetes-specific prediction models were developed for estimating the risk of first CVD event (coronary heart disease, ischaemic and haemorrhagic stroke, transient ischaemic attack, peripheral vascular disease, congestive heart failure). In both sets of models, identical definitions of the outcome and predictors, and similar ways were applied to model development. Sex-specific models with Cox regression methods were developed using pre-specified clinically-relevant risk predictors. For the PREDICT-1o models, developed in the total cohort of patients with and without diabetes, these were age, ethnicity, deprivation, smoking, diabetes status, family history of premature CVD, history of atrial fibrillation, systolic blood pressure, TC:HDL, and therapy with antithrombotic, blood pressure lowering and lipid lowering medications. For the PREDICT T2D models, developed in patients with type-2 diabetes, various compatible predictors were added to the above: duration of diabetes, glomerular filtration rate, albuminuria, haemoglobin A1c, body mass index, and therapy with oral hypoglycaemic medications and insulin. A standard set of performance indicators were used to compare performance of the diabetes-specific models and the general population models, in T2D population.
The diabetes-specific models were developed from 46,652 patients with type-2 diabetes. The median follow-up was 5.2 years (244,840 person-years), a total of 4,114 patients underwent an event (9% fatal). The general population models were developed from 401,752 patients, of whom 15,386 underwent an event (10% fatal) in 1,685,521 person-years follow-up. The T2D-specific models executed superior as compared to PREDICT-1o, in terms of discrimination, calibration, explained difference and net advantage. Discrimination was good, with C statistic of 0.7 in both men and women, and Royson’s D of 1.082 and 1.346, respectively. Calibration plots also designated T2D models’ excellent calibration. The net advantage evaluation exhibited that diabetes-specific models were better to the general population models at all clinically meaningful thresholds of risk.
Comparative evaluation of the general population and T2D-specific models exhibited that addition of clinically compatible predictors enhances models’ performance in patients with diabetes. Therapy with insulin, estimates of renal function, and body composition contribute substantially to cardiovascular risk prediction in type-2 diabetes.
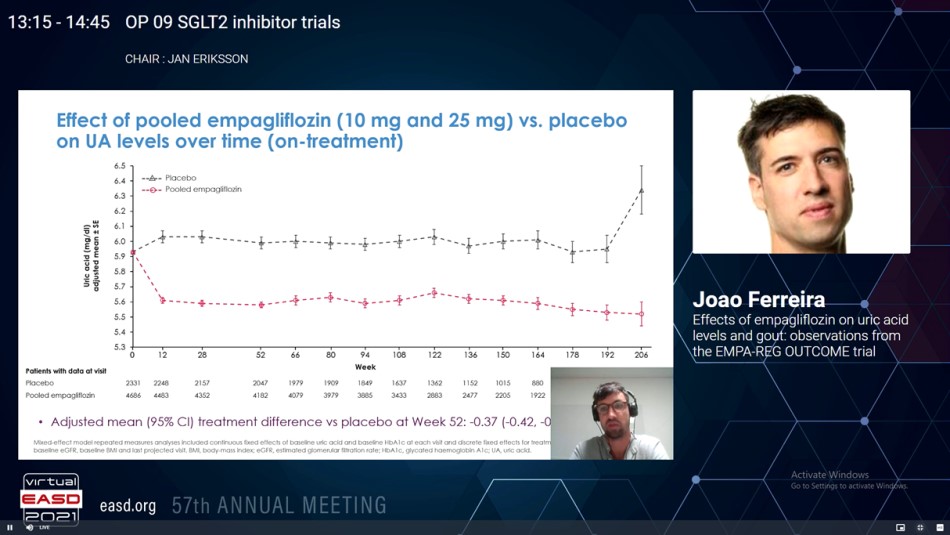
Effects of Empagliflozin on Uric Acid Levels and Gout: Observations from the EMPA-REG OUTCOME Trial
Higher serum uric acid (UA) levels are correlated with gout and other adverse health effects in patients with type 2 diabetes (T2D). Sodium glucose co-transporter 2 inhibitors (SGLT2i) decreases UA. Additionally, the SGLT2i Canagliflozin decreased gout flares in patients with T2Din the CANVAS program. Whether Empagliflozin also positively effects new-onset of gout or anti-gout medication in T2D patients has not been fully analysed. Ferreira JP, presented a study in a session at Virtual EASD Annual Meeting 2021 on 28th September 2021 which studied the impact of Empagliflozin on UA levels, event prescription of an anti-gout/UA-lowering medication or an episode of gout as an adverse event in the EMPA-REG OUTCOME trial.
7,020 patients with T2D at high CV risk were managed with either Empagliflozin (pooled n=4,687; 10 mg/day n=2,345; 25 mg/day n=2,342) or placebo (n=2,333) in EMPA-REG OUTCOME. The impacts of Empagliflozin vs. placebo on serum UA levels were analysed by MMRM analyses and Cox proportional hazards models for the time-to-first incidents of either an adverse event assigned to gout flare or initiation of a drug for the therapy of hyperuricemia or gout while patients were on-therapy.
From the 7,020 patients incorporated at baseline, 413 (6%) were taking UA-lowering medications and 6,607 (94%) were not. Patients on UA-lowering medications were older, more commonly male, showed a higher BMI, longer T2D duration, poorer kidney function, higher albuminuria, and more frequently managed with diuretics. At 12 weeks, Empagliflozin-treated patients exhibited lower mean serum UA level vs. placebo, and this difference was maintained across all following time points; by week 52 the adjusted mean (95% CI) therapy difference was −0.37 (−0.42, −0.31) mg/dL. The adjusted mean therapy difference (95% CI) was more pronounced with baseline UA levels ≥6 mg/dL (−0.46 (−0.55, −0.38) mg/dL, panel A) in serum UA at week 52. In the 6,607 patients not taking UA lowering medications at baseline, the pooled Empagliflozin group showed lower gout flare or initiated a drug for the therapy of gout as compared to placebo group (3.6% vs 5.2%), corresponding to incidence rates of 21.6 vs.14.1 events per 1,000 patient-years, and a hazard ratio (95% CI) of 0.67 (0.53, 0.85), p=0.001 (panel B). The event rate reduction was similar with either Empagliflozin 10 or 25 mg and in patients with baseline UA levels below or above 6.0 mg/dL as well as with vs. without a medical history of gout at baseline (interaction p=0.53 and 0.48, respectively).
Empagliflozin showed reduction in mean UA, the requirement for UA lowering medications or gout flares vs. placebo. These data support additional analyses for SGLT2i in the prevention of gout and reduction of anti-gout medication.