Miao L. BMC Nephrol. 2021 Jan 20;22(1):35.
Most patients with CKD possess CVD before they progressed to ESRD, which is associated to abnormal lipid metabolism. Even though there is a strong correlation among CKD and serum lipids, this procedure has not been entirely described. MR technique yields an economical and efficacious approach to solve this issue in epidemiological research. The main principle of this procedure is that different genotypes ascertain various intermediate phenotypes, and Mendel’s law of independent distribution affirms that the intermediate genes are randomly allocated to the gametes of the offspring in the activity of gamete formation. Miao L, et al., conducted a study to estimate the role of serum lipid levels in the etiology of CKD with a TSMR study.
A genetic variants were selected; were associated with serum TC (n = 187,365), TG (n = 177, 861), HDL-C (n = 187,167), LDL-C (n = 173,082), ApoA1 (n = 20,687) and ApoB (n = 20,690) levels and CKD data (n = 117,165); then the largest consortium GWAS summary-level dataset was used to extract the corresponding effect sizes for CKD. These are SNPs, which were substantially correlated genome-wide with serum lipid levels from the GLGC and CKDGen consortium GWAS. IVW was used as the key procedure to estimate the causal impact among serum lipid level and CKD for TSMR evaluation. Later, leave-one-out sensitivity evaluation was executed to screen out whether the association was out of connection to be impacted with a single SNP.
Almost 7 independent SNPs (p < 5 × 10− 8, r2 < 0.001) were correlated with TC, 13 independent SNPs were correlated with TG, 4 SNPs were correlated with HDL-C, 4 SNPs were correlated with LDL-C, 7 SNPs were correlated with ApoA1 and 9 SNPs were correlated with ApoB using independent and LD evaluations. The OR and 95% CI of TC within CKD was 0.756 (0.579 to 0.933) (p = 0.002), TG was 1.021 (0.898 to 1.144) (p = 0.739), HDL-C was 0.85 (0.687 to 1.012) (p = 0.049), LDL-C was 1 (0.747 to 1.253) (p = 0.998), ApoA1 was 0.999 (0.888 to 1.11) (p = 0.98) and ApoB was 0.909 (0.757 to 1.061) (p = 0.217). This procedure genetically forecasted the causal impact among TC/HDL-C and CKD (Figure 1).
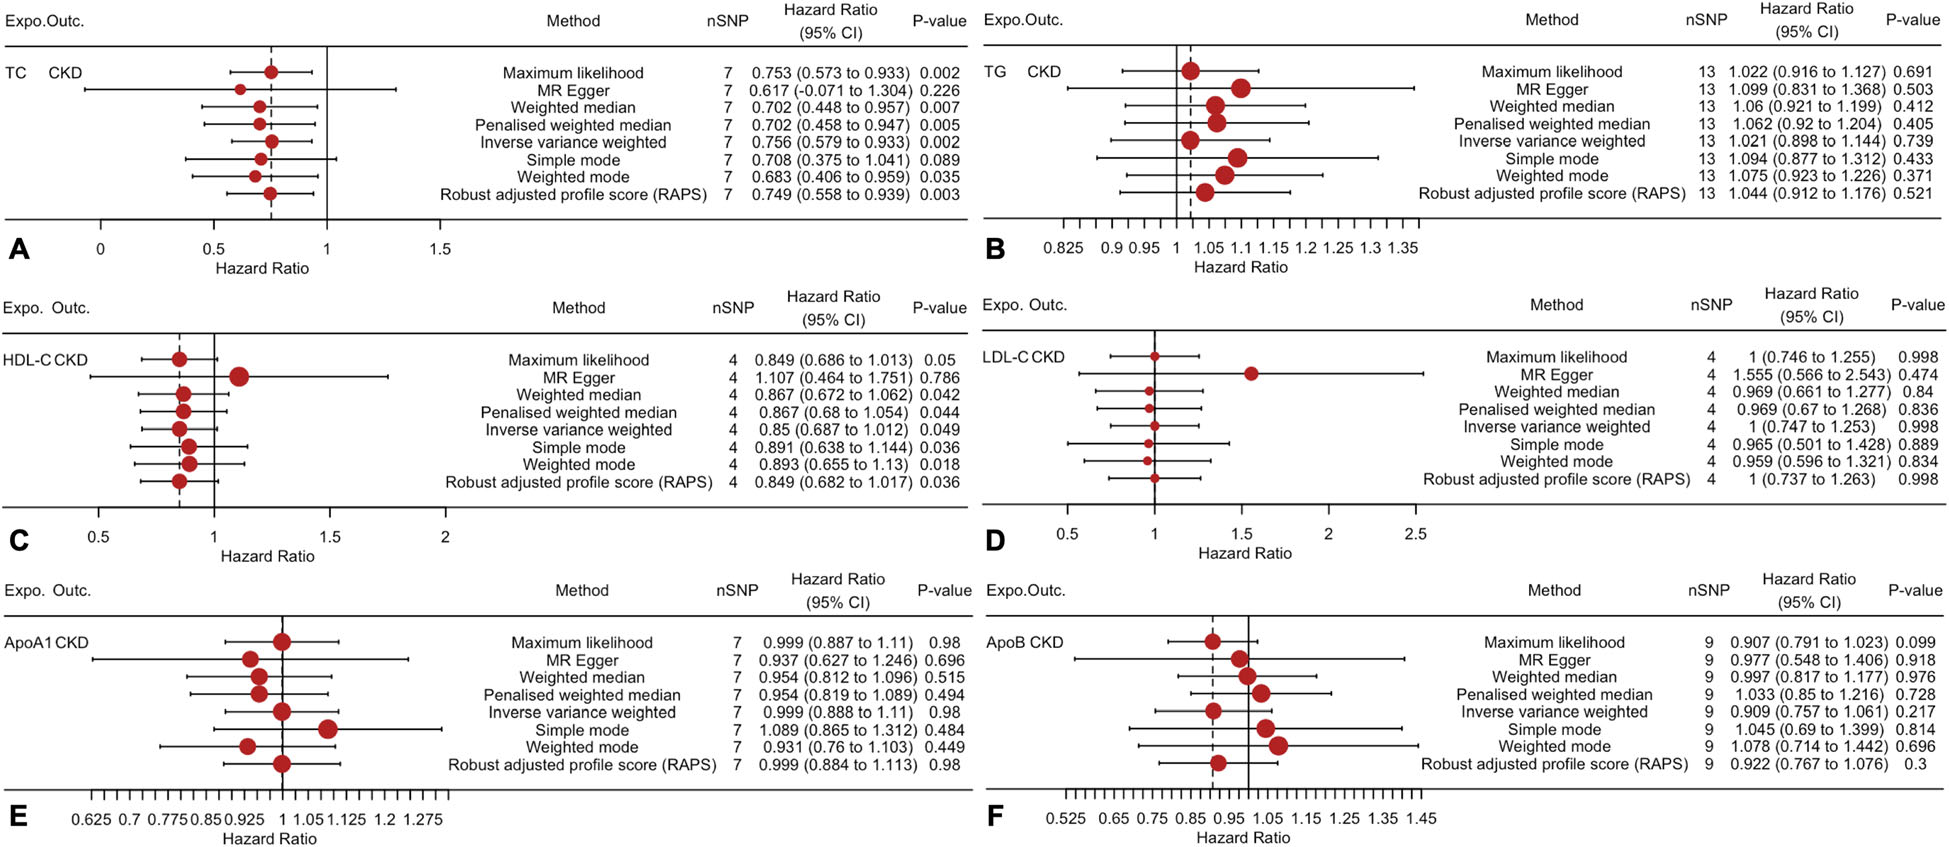
Figure 1: Two-sample mendelian randomization of serum lipid level and the risk of CKD.
The correlation among serum lipid levels and CKD exhibited a positive association between a reduction in TC and an elevation in HDL-C and the incidence of CKD (Figure 2).
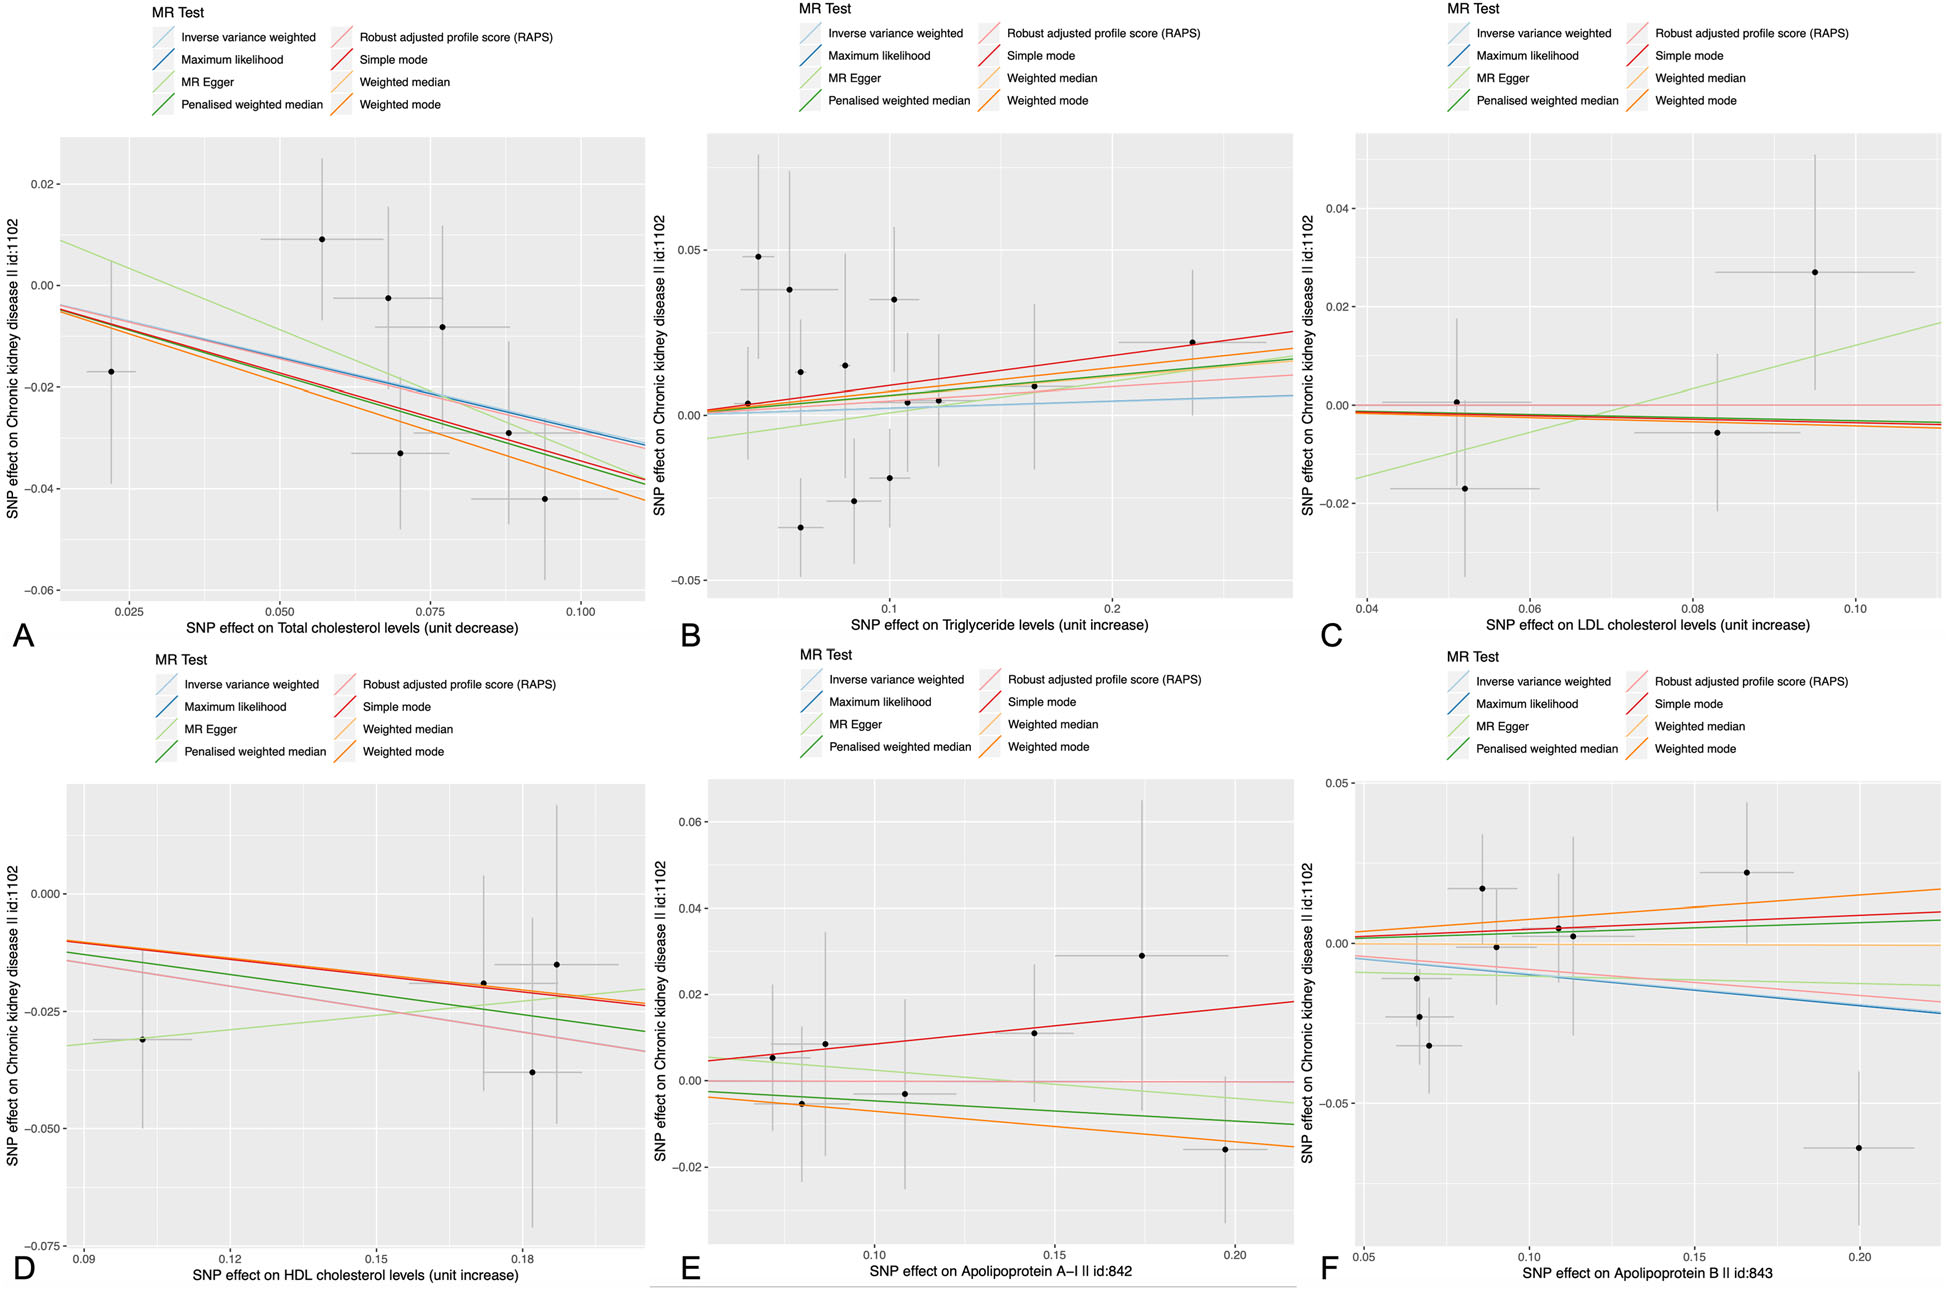
Figure 2: Scatter plots of the estimated SNP effects on serum lipid level (x-axis) plotted against the estimated SNPs effects on the CKD (y-axis). The slope of the line corresponds to a causal estimate using a different method.
The overall estimates exhibited no causal impacts among TG, LDL-C- ApoA1, ApoB and CKD; as measured by IVW or MR-Egg (Figure 3 and 4).
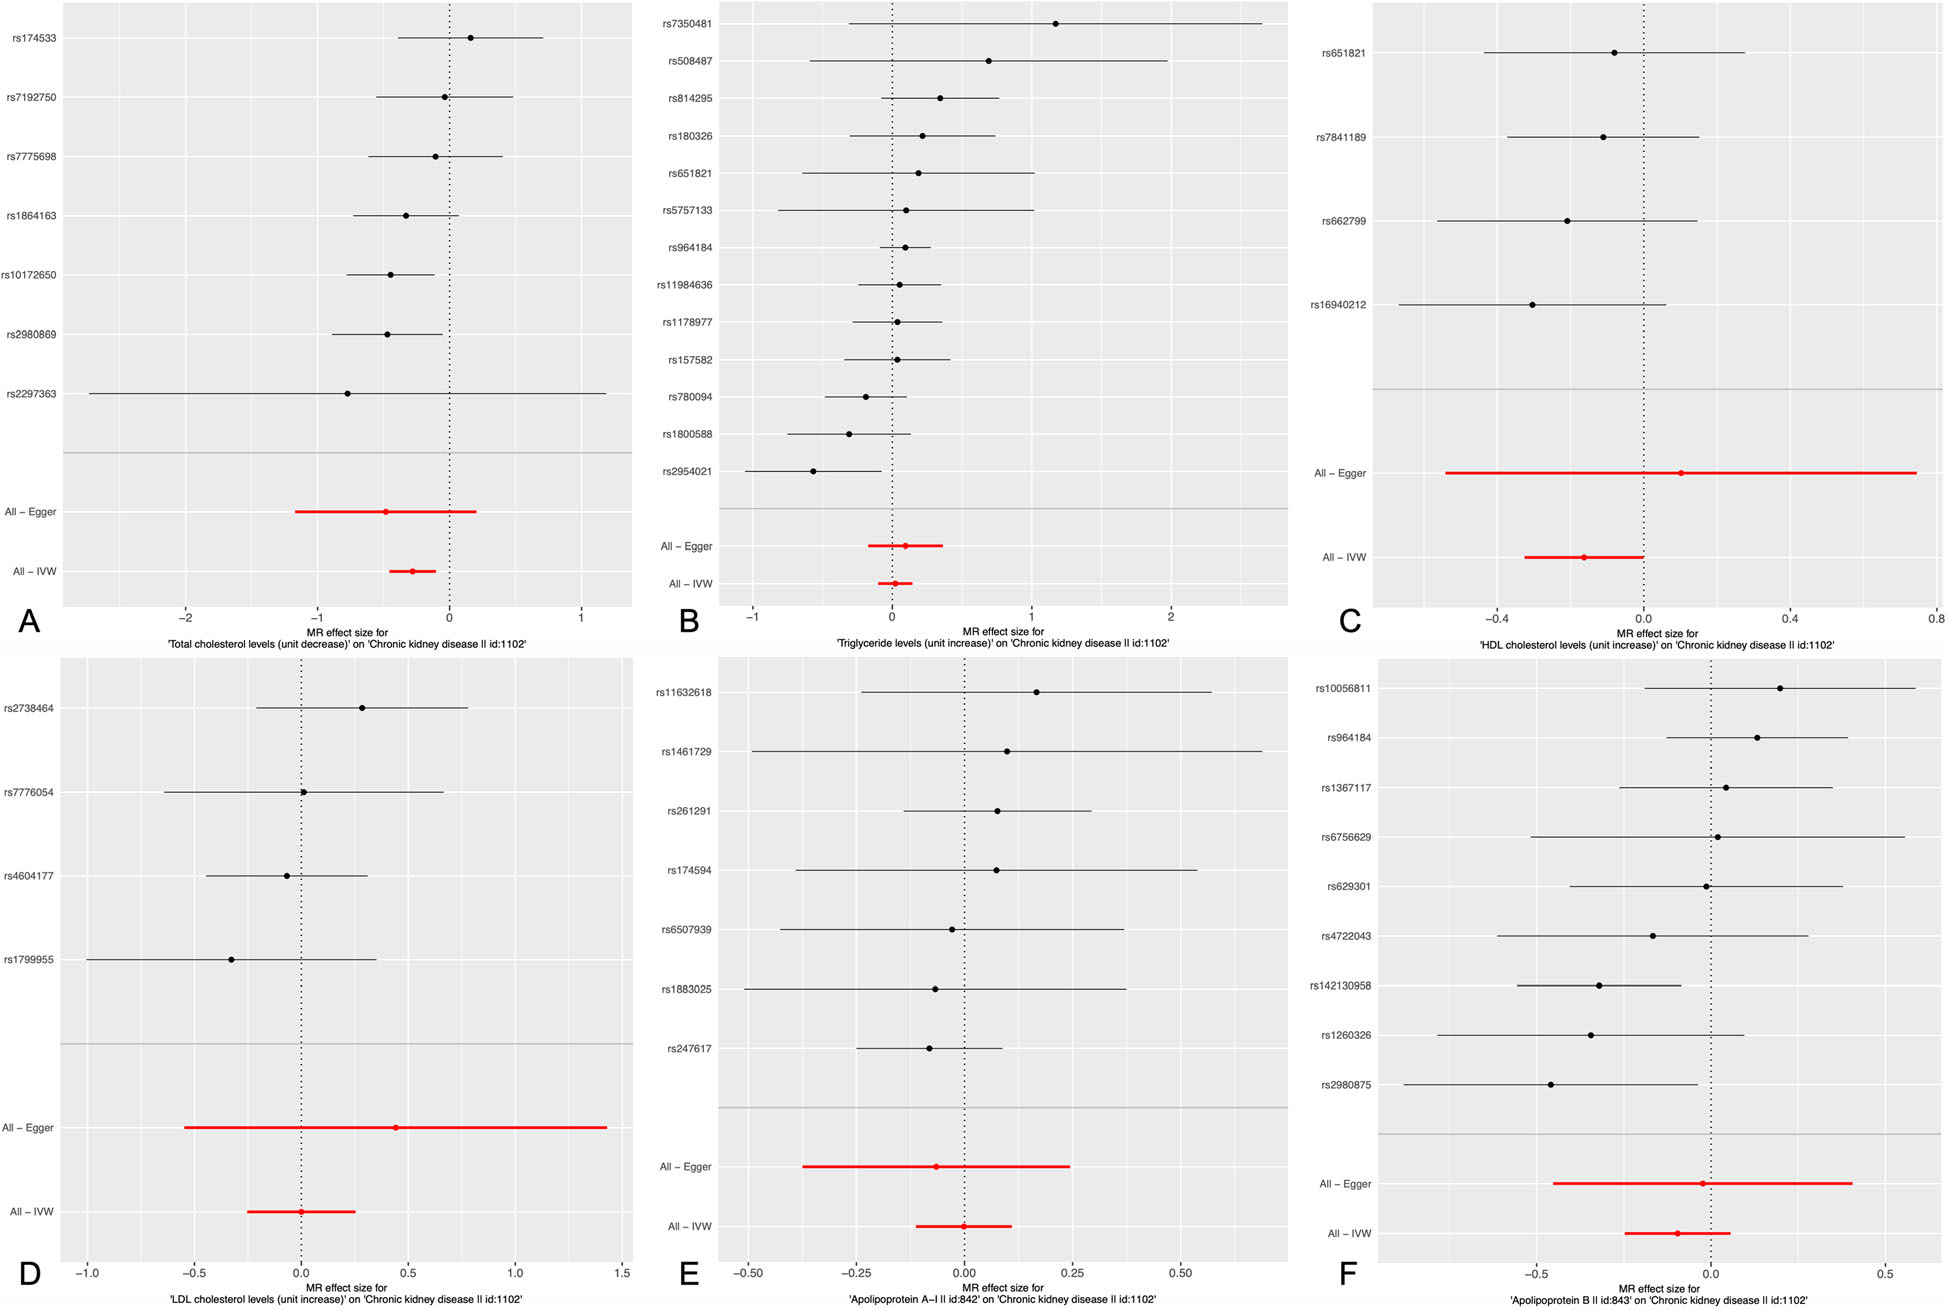
Figure 3: Results of the single and multi SNP analyses for the SNP effect of serum lipid level on CKD. The forest map, where each black dot represented a single SNP as IV, showed the logarithm of the 95% OR confidence per standard deviation under the influence of serum lipid level; the red dot showed the use of IVW results for all SNPs; the horizontal line indicated the 95% CI.
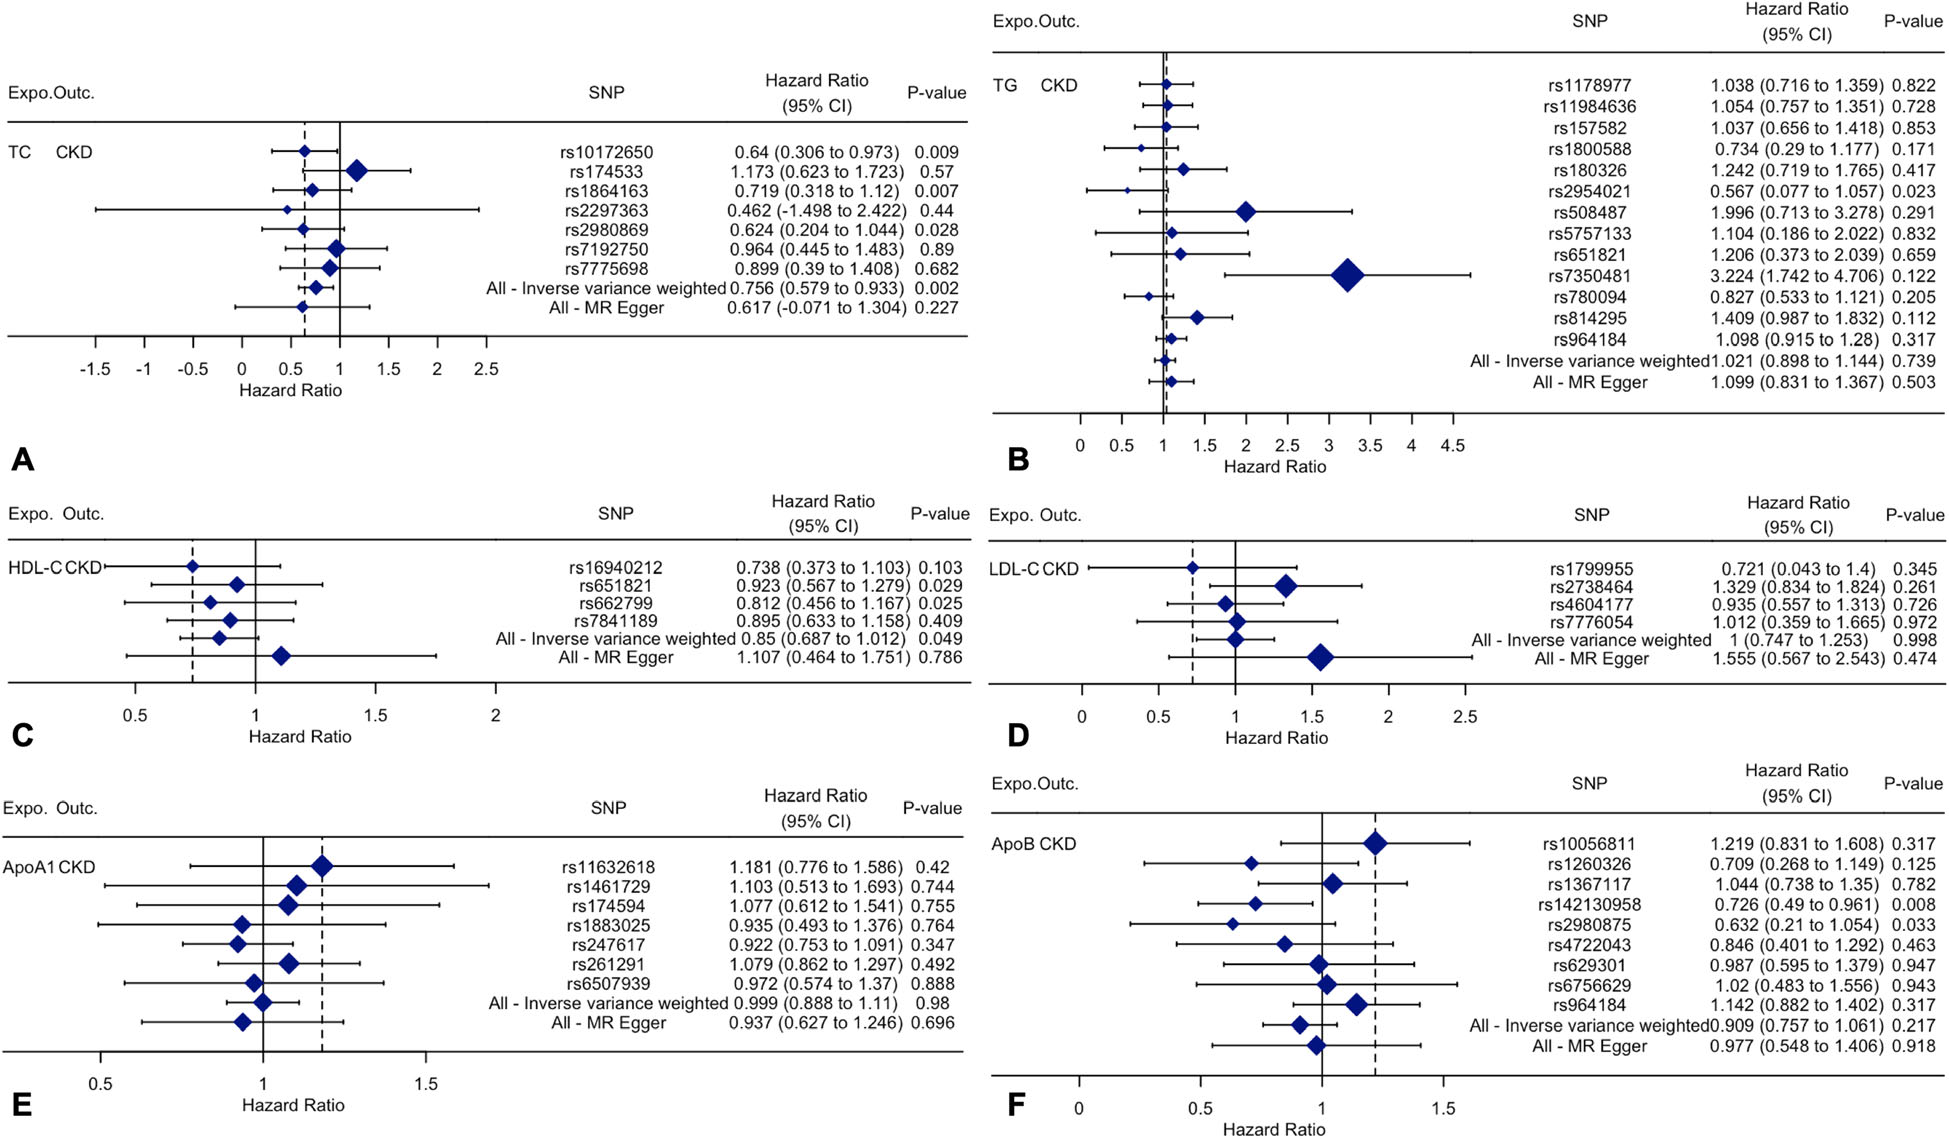
Figure 4: The details of SNP analyses for the SNP effect of serum lipid level on CKD.
Sensitivity analyses affirmed that TC and HDL-C were substantially correlated with CKD (Figure 5 and 6).
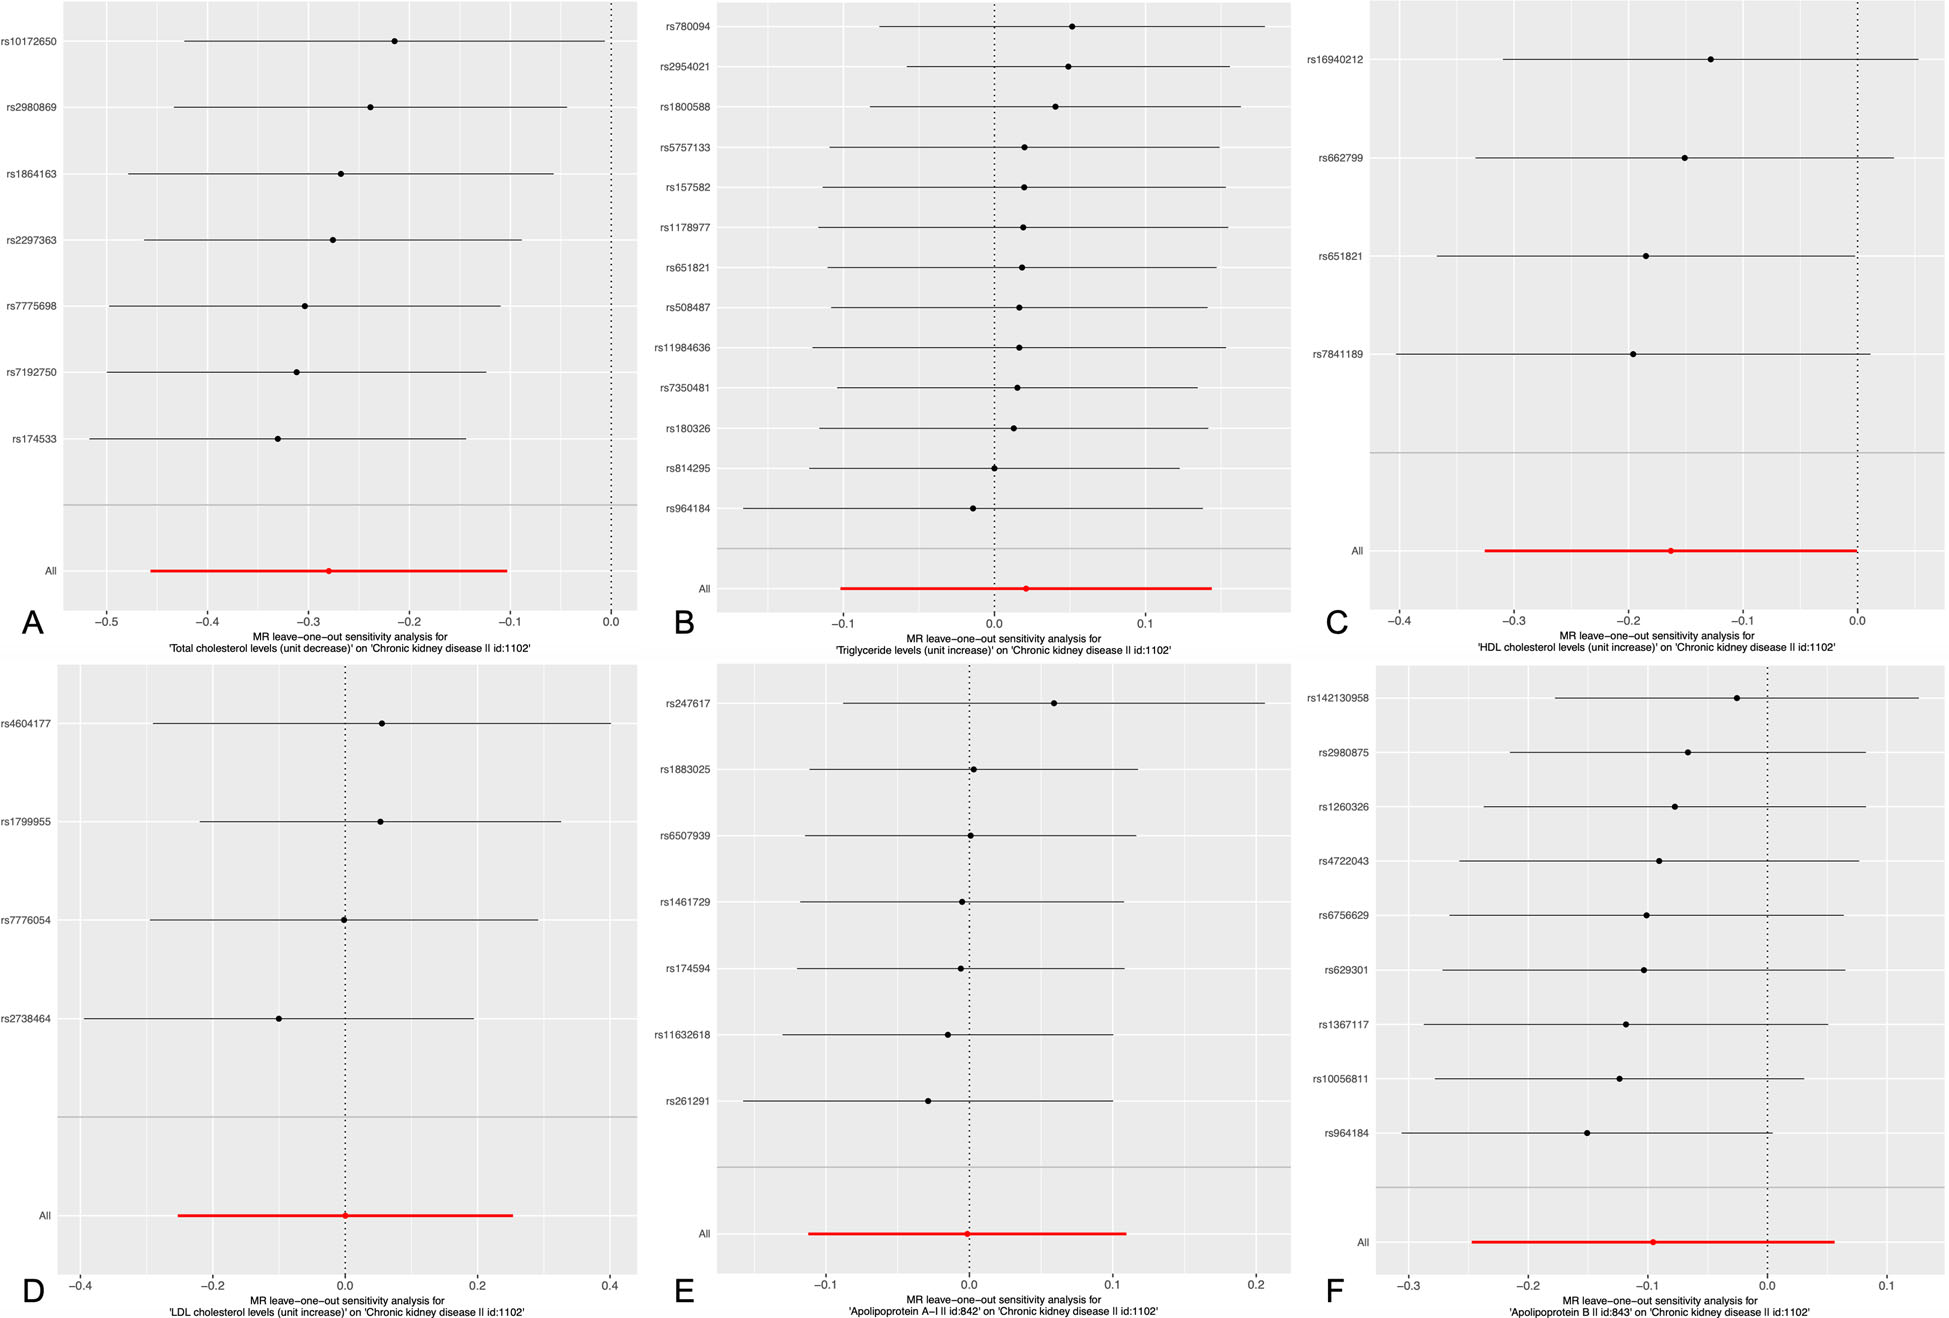
Figure 5: Sensitivity analyses using the leave-one-out approach on the association of serum lipid level on CKD. Each black dot represents an IVW method for estimating causal the effect of the line serum lipid level on the CKD does not exclude a case where a particular SNP caused a significant change in the overall results.
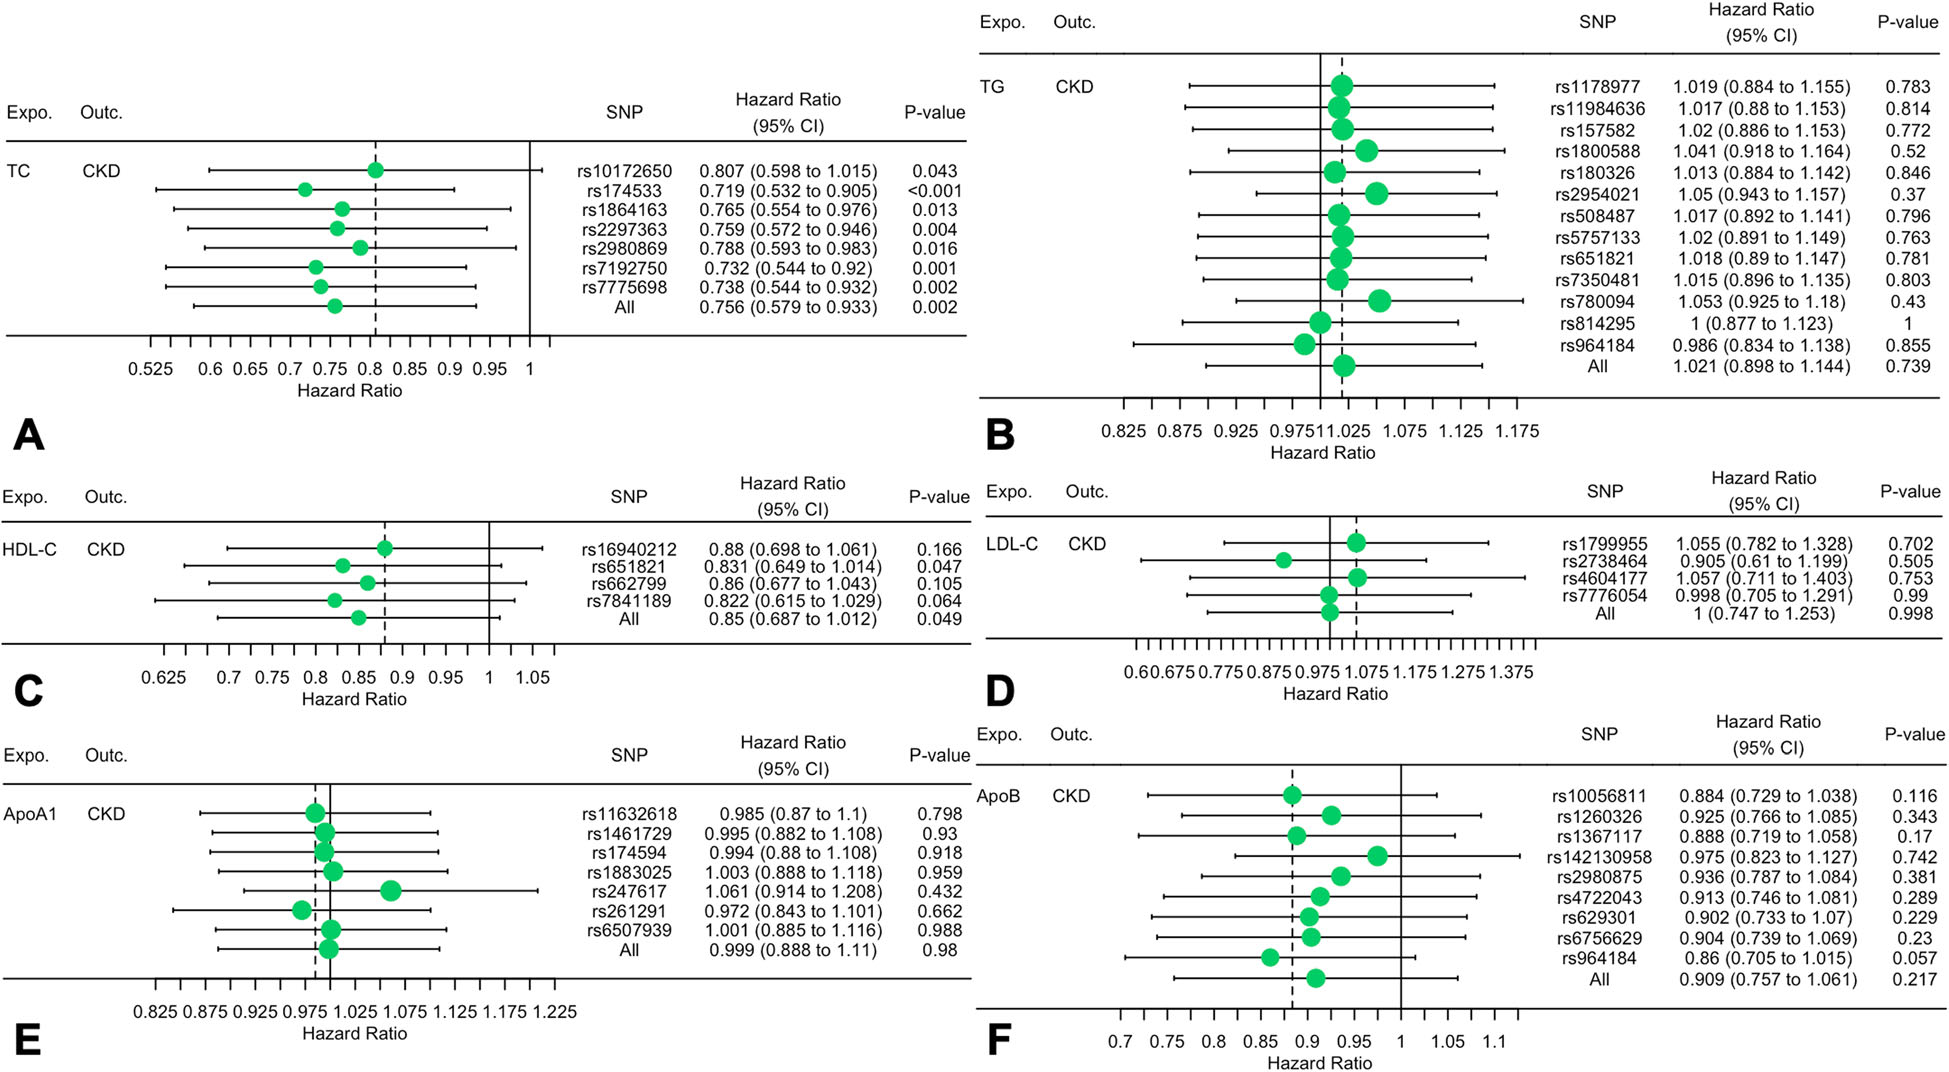
Figure 6: The details of Sensitivity analyses for the leave-one-out approach on the association of serum lipid level on CKD.
Thus, it was concluded that serum TC and HDL-C are causally correlated with CKD risk by executing TSMR evaluation. Reduced TC and increased HDL-C may decrease the incidence of CKD.
(a) TC; (b) TG; (c) HDL-C; (d) LDL-C (e) ApoA1; (f) ApoB. Expo: exposure; Outc: outcome. CKD: Chronic kidney disease; CVD: Cardiovascular diseases; TSMR: Two-sample mendelian randomization; ESRD: End-stage renal disease; TC: Total cholesterol; TG: Triglyceride; HDL-C: High-density lipoprotein cholesterol; LDL-C: Low-density lipoprotein cholesterol; Apo: Apolipoprotein; CI: Confidence interval; MR: Mendelian randomization; GWAS: Genome-wide association study; SNPs: Single nucleotide polymorphisms; IVW: Inverse variance weighted; GLGC: Global lipids genetics consortium; CKDGen: Chronic kidney disease genetics