Massari F, et al. J Cardiol. 2020 Jan;75(1):47-52.
Massari F, et al., conducted a study to estimate the prognostic value of brain natriuretic peptide (BNP), estimated plasma volume status (ePVS), bioimpedance vector analysis (BIVA), and blood urea nitrogen/creatinine ratio (BUN/Cr) in HF.
Almost 436 patients [AHF (n = 184) and CHF (n = 252), respectively] with acute or chronic heart failure were included in this study and the data were assessed. During admission, BNP, ePVS, hydration index (HI%), and BUN/Cr were assessed from all patients. All-cause mortality was included in the primary endpoint.
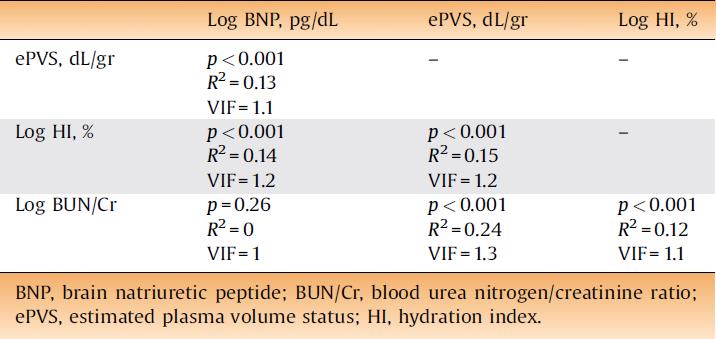
No significant correlation was observed between BNP and BUN/Cr values, whereas a slight and significant linear association was observed among other markers of congestion (VFI <2 for all) (Table 1).
Table 1: Correlation and collinearity between markers of congestion
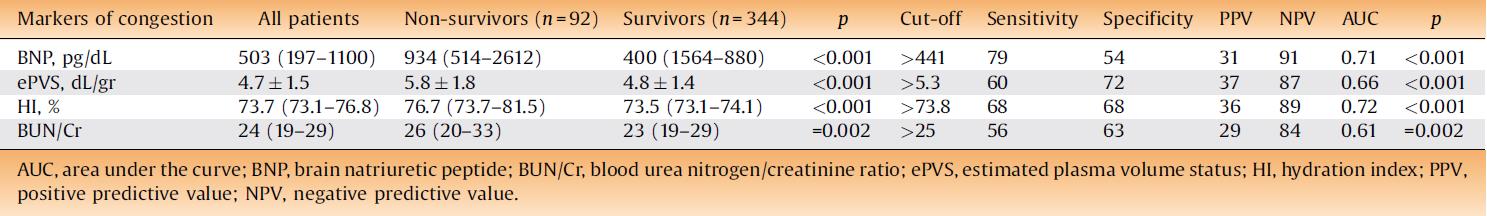
During median follow-up of 463 days, 92 patients died after 1–840 days. The cumulative mortality of all of the participants was 21% (31% and 13% in AHF and CHF, respectively, p < 0.0001). The ideal cut-offs for mortality occurrence were observed as: >441 pg/mL for BNP, ePVS: >5.3 dL/g for ePVS, >73.8% for HI, and >25 for BUN/Cr (Table 2).
Table 2: Baseline markers of congestion as a function of all-cause mortality
A significant increase in all-cause mortality rate was indicated by Kaplan–Meier analysis when the values of the markers of congestion were above the measured cut-off (Figure 1).
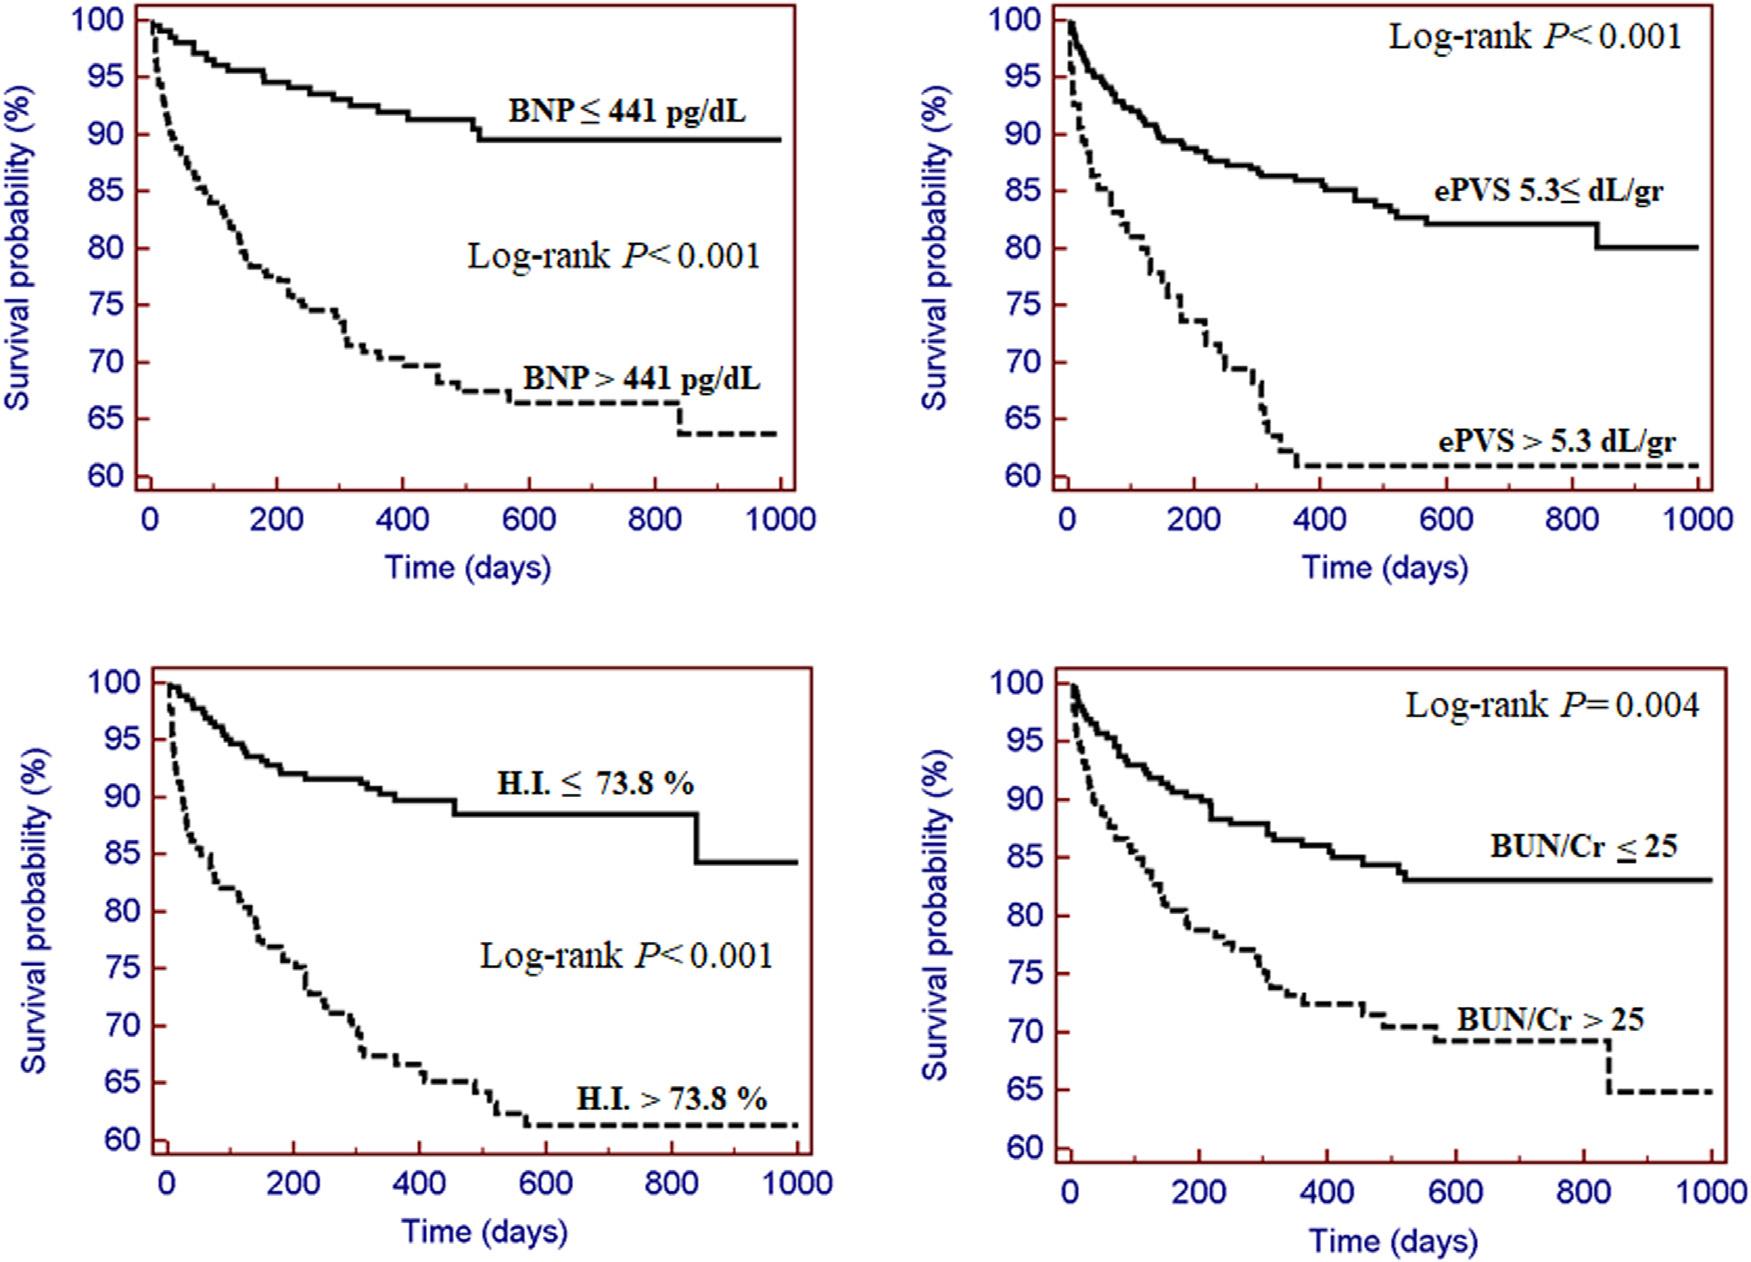
Figure 1: Average number of atherosclerotic cardiovascular disease risk factors in sudden death cases and living controls, among all subjects
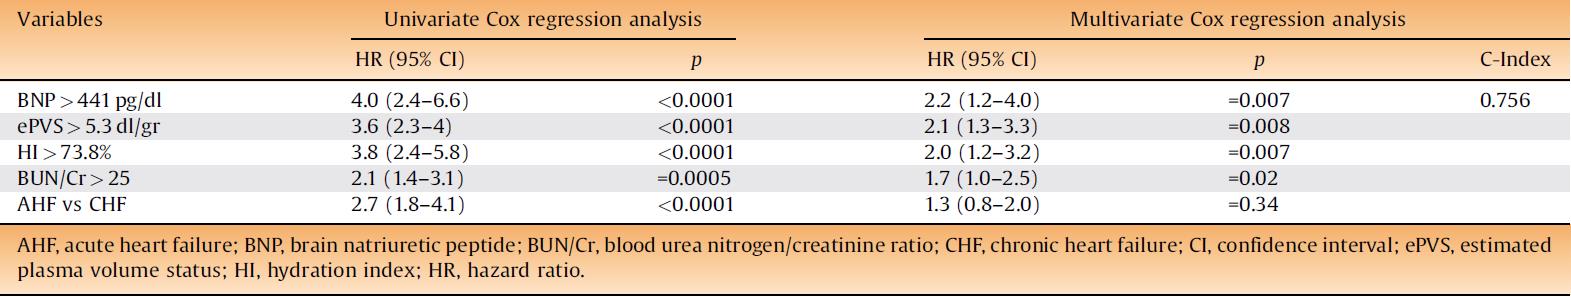
BNP, ePVS, HI, and BUN/Cr persisted as independent pointers of all-cause mortality in the multivariate Cox regression analysis, whereas AHF status was not anymore linked with death (Table 3).
Table 3: Predictive value of optimal cut-off of brain natriuretic peptide, estimated plasma volume, hydration index, and blood urea nitrogen/creatinine ratio
The death prediction rate of patients with all four parameters below or above their optimal cut-off were 4% and 59%, respectively. In the group with all four markers, the risk of mortality increased by 17-fold above the cutoff values (Figure 2).
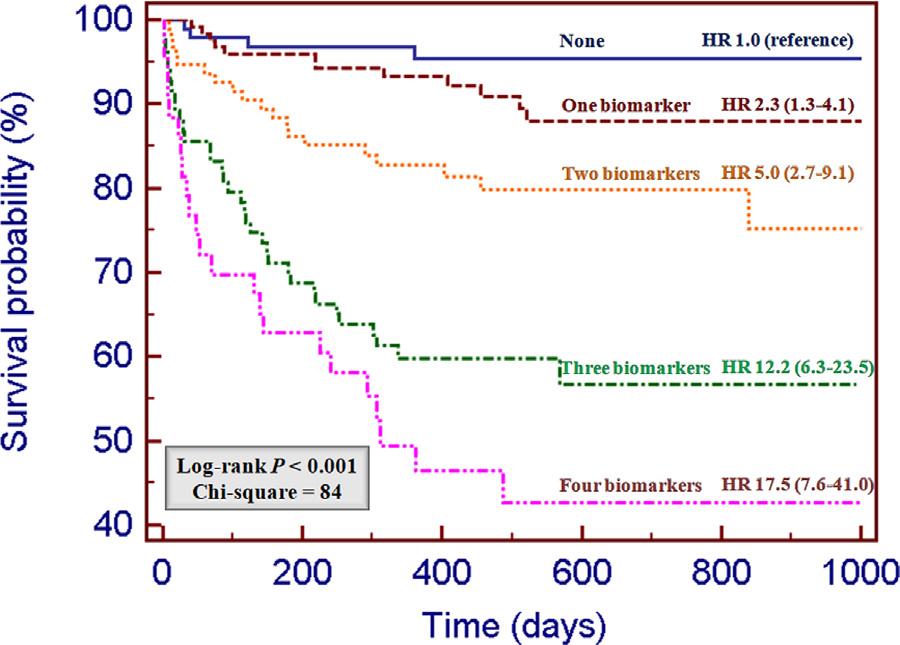
Figure 2: Kaplan–Meier survival curves according to the presence of none (n = 94), one (n = 122), two (n = 94), three (n = 83), or four (n = 43) markers of congestion above the optimal cut-off. HR: hazard ratio (95% confidence intervals) versus group with no markers of congestion
Thus, BNP, ePVS, BIVA, and BUN/Cr at admission offer independent and additional prognostic details in HF patients and, when assembled, interpret the 40% risk of mortality in these patients independent from the acute or chronic HF condition.