Sodium–Glucose Cotransporter-2 Inhibitors (SGLT2i) Decrease Kidney Oxygen Consumption Using Consumption in Adults with Type 2 Diabetes (T2D)—A Randomized Clinical Trial Using 11C-Acetate Positron Emission Tomography (PET) Imaging
Kidney hypoxia has been proposed as a key pathophysiological mechanism in the development of chronic kidney disease, potentially stemming from a mismatch between oxygen delivery and oxygen consumption. SGLT2i are kidney protective drugs that initially lower glomerular filtration rate (GFR).
Hesp P, presented a session at the American Diabetes Association (ADA) held in San Deigo, United States between 23rd-26th June 2023 that evaluated whether SGLT2i lower kidney oxygen consumption by reducing GFR and associated tubular workload.
The study included twenty adults with T2D (sex 80% male, age 68±6 years, BMI 30±4 kg/m2, HbA1c 7.5±0.9%, eGFR 76 ± 11 mL/min/1.73m2) who received a 4-week treatment with SGLT2i ertugliflozin (ERTU) and matched placebo (PLB) in a randomized, double-blind cross- over study. Participants were treated with metformin and received a maximal tolerable dose of an angiotensin-receptor blocker. Whole-kidney oxygen consumption (Kmono) was measured by PET using 11C-acetate. GFR was measured by gold-standard iohexol clearance. Tubular sodium transport (TNa) was calculated by kidney sodium load (([arterial Na]*mGFR) – urinary sodium excretion). Kidney efficiency was calculated as TNa/ Kmono. GFR was lower during ERTU (94 ± 14 mL/min) vs. PLB (99 ± 15 mL/min) treatment (p=0.02). Kmono was 0.086 ± 0.006 min-1 during ERTU and 0.091 ± 0.009 min-1-1 during PLB (p<0.01). Kidney sodium load (12.9 ± 1.90 vs 13.7 ± 2.22 mmol/min) and TNa (12.7 ± 1.87 vs 13.6 ± 2.18 mmol/min) were lower during ERTU (p=0.02 for both), while urinary sodium excretion (p=0.1) and TNa/ Kmono remained unchanged (p=0.7). TNa was strongly associated with Kmono (r=0.50; p<0.0001).
SGLT2i lowers mGFR, TNa, and kidney oxygen consumption, potentially decreasing hypoxia risk. SGLT2i treatment did not lower overall kidney efficiency, despite the ATP efficiency of cortical sodium transport.
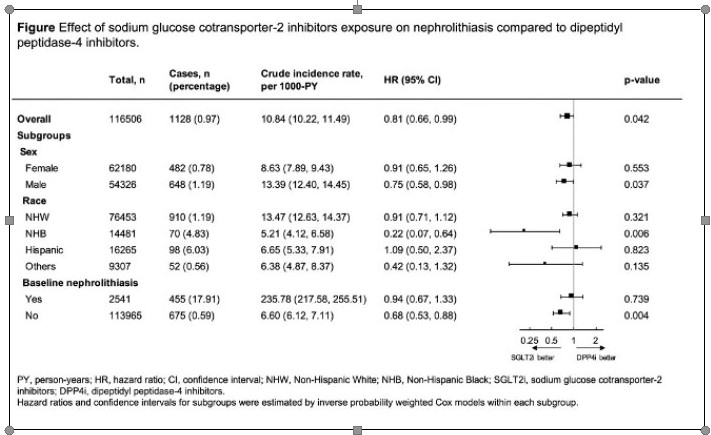
Heterogenous Effects of SGLT2 Inhibitors on Nephrolithiasis in Older Adults with Type 2 Diabetes
Li Y. presented a study at the 83rd Scientific Sessions, American Diabetes Association on June 25, 2023. In order to further explore the potential association between sodium-glucose cotransporter-2 inhibitors (SGLT2i) and the risk of nephrolithiasis (kidney stone formation), we conducted a real-world study involving a population of individuals with type 2 diabetes (T2D). Our study aimed to provide additional evidence regarding this relationship.
For this analysis, they utilized a 15% random sample of Medicare fee-for-service beneficiaries with T2D from the years 2017-2018. We identified individuals who initiated either SGLT2i or dipeptidyl peptidase-4 inhibitors (DPP4i). The cohort was followed until the first medical encounter with a diagnosis of nephrolithiasis, death, or until December 31, 2018. We employed inverse probability treatment weighting to balance baseline characteristics, including sociodemographic factors, prior comorbidities, and medication use.
Among the 116,506 individuals included in the study (with an average age of 72 years and 53% women), 0.96% developed nephrolithiasis during a median follow-up period of 360 days. The crude incidence rate was 9.89 per 1000 person-years (95% confidence interval [CI] 8.49- 11.52) in the SGLT2i group and 11.02 per 1000 person-years (95% CI 10.34-11.73) in the DPP4i group. Notably, exposure to SGLT2i was associated with a significantly lower risk of nephrolithiasis (hazard ratio 0.81, 95% CI 0.66-0.99).
In conclusion, the study adds to the existing body of evidence by demonstrating that SGLT2i usage is associated with a reduced risk of nephrolithiasis in individuals with T2D. Moreover, this effect appears to be more prominent in specific subgroups, including men, NHB individuals, and those without a prior history of nephrolithiasis. These results support the potential role of SGLT2i in reducing the risk of kidney stone formation in individuals with T2D.
Protective Effects of DPP-4 Inhibitor and SGLT2 Inhibitor on Pancreatic ß-Cell Function– Randomized, Parallel-Group, Multicenter, Open-Label Study (SECRETE-I)
Shimoda M. presented a study at the 83rd Scientific Sessions, American Diabetes Association on June 25, 2023. The effects of dipeptidyl peptidase-4 (DPP-4) inhibitors and sodium-glucose cotransporter 2 (SGLT2) inhibitors on human β-cell function in patients with type 2 diabetes have not been fully elucidated, and no studies have compared the differences between these two classes of drugs. Therefore, the aim of this study was to compare the effects of DPP-4 inhibitors and SGLT2 inhibitors on β-cell function in patients with type 2 diabetes.
The study protocol was approved by the Institutional Review Board of Kawasaki Medical School (No. jRCTs061190008). A total of 103 patients who met the inclusion criteria (age range: 20 to 79 years, HbA1c levels: ≥7.0% and <9.0%) were enrolled in the study. The subjects were randomly assigned to either the luseogliflozin (L) group (n=49) or the teneligliptin (T) group (n=54). They received 24 weeks of intervention with their respective drug, followed by a 1-2 week period of drug washout. The primary endpoint was the change in log-transformed (Ln) disposition index (DI) from baseline. All subjects underwent a 75g oral glucose tolerance test (OGTT) before and after the treatment period.
The main baseline characteristics of the L and T groups were as follows: age (60.8±11.1 vs. 62.6±11.2 years, p=0.4), duration of diabetes (10.1±7.9 vs. 9.2±7.6 years, p=0.6), body mass index (27.0±4.2 vs. 27.2±5.4 kg/m², p=0.8), HbA1c levels (7.6±0.4 vs. 7.5±0.5%, p=0.5), and DI (0.80±0.60 vs. 0.92±0.59, p=0.1). Both groups showed a significant reduction in HbA1c levels, but the magnitude of change was greater in the T group (-0.2%, p=0.02). Only the L group showed a significant decrease in body weight, with a between-group difference of -2.5 kg (p<0.001). Ln DI values improved in both groups: from -0.46±0.66 to -0.15±0.59 (p=0.01) in the L group and from -0.26±0.60 to -0.02±0.60 (p=0.003) in the T group. The change in Ln serum proinsulin/C-peptide ratio, a marker of β-cell dysfunction, decreased in the L group (from 1.63±0.63 to 1.56±0.68, p=0.16), but increased in the T group (from 1.70±0.75 to 1.90±0.51, p=0.01), with a significant difference observed between the two groups (-0.27; p=0.004).
The improvement in DI was similar between the luseogliflozin and teneligliptin groups. However, only the luseogliflozin group showed a mitigation of β-cell burden, as indicated by the reduction in the Ln serum proinsulin/C-peptide ratio.
Evaluation of Hypoglycemic Risk in Patients with Type 2 Diabetes on Hemodialysis under Tight Glycemic Control
Patients with type 2 diabetes on hemodialysis (T2HD) have unique glycemic profile resulting from hemodialysis, especially hemodialysis-related hypoglycemia, which is present in approximately 20% of them.
Hayashi A, presented a session at the American Diabetes Association (ADA) held in San Deigo, United States between 23rd-26th June 2023 that evaluated the 48-hour sensor glucose level (SGL) on dialysis and non-dialysis days, and time in range (TIR, 70-180 mg/dL), time below range (TBR, <70 mg/dL) in 115 T2HD using continuous glucose monitoring (CGM) and the difference in clinical parameters between well-controlled group (TIR >70% and TBR <4%) and hypoglycemia group (TIR >70% and TBR ≥4%).
Sixty-six patients of the well-controlled group (46 males, age 62±12 years, HbA1c 6.0±0.9%, glycated albumin (GA) 18.5±4.1%) and 11 cases of hypoglycemia group (8 males, age 65±13 years, HbA1c 5.9±0.7%, GA 17.4±3.6%) were selected for retrospective analysis. There were no differences in sex, age, dry weight, body mass index, duration of diabetes, or duration of dialysis between two groups. Likewise, HbA1c and GA were not significantly different (P=0.7044, P=0.4151).
The study showed that the glucose levels at both the beginning and the end of dialysis were significantly lower in the hypoglycemia group (164.1±42.8 mg/dL vs. 131.0±49.2 mg/dL (P=0.0227) and 118.8±40.2 mg/dL vs. 86.8±26.1 mg/dL (P=0.0130), respectively). On the other hand, CGM data showed significantly lower mean SGL (P=0.0005) and significantly higher coefficient of variation of SGL (P=0.0014) in the hypoglycemia group. Thus, both HbA1c and GA are not sufficient to predict the presence of hypoglycemia in strict glycemic control in T2HD.
Therefore, for good glycemic control without hypoglycemia in T2HD, it is important to measure glucose levels at the beginning and end of dialysis and to evaluate glucose profiles by CGM.
ADA Presidents’ Select Abstract: Risk Symmetrical Risk Factors for Distal Symmetrical Polyneuropathy Diabetes Polyneuropathy (DSPN) in the Diabetes Prevention DPP Prevention Program (DPP) and the DPP Outcomes Study (DPPOS)
Lee C, evaluated how DSPN differs across the randomized DPP treatment groups and is associated with diabetes (DM) status, DM duration, and cumulative glycemic exposure and discussed the results at the American Diabetes Association (ADA) held in San Deigo, United States between 23rd-26th June 2023.
In the DPP, adults ≥25 years of age at high risk for DM (n=3234) were randomized to determine the effects of intensive lifestyle modification (ILS) or metformin (MET) compared to placebo (PLA) on incident diabetes. After DPP ended, participants were invited to join the DPPOS during which metformin was continued in those randomized to receive it. DSPN was rigorously assessed in 1,792 participants at DPPOS year 17 based on both symptoms and signs (pinprick, vibration, and monofilament). Multivariable logistic regression models were used to determine whether DSPN was associated with randomized treatment groups, DM status and duration, and cumulative glycemic exposure.
The results observed were at 21 years following DPP randomization, 66% had developed DM with a median duration of 15 years. The prevalence of DSPN did not differ by DPP treatment group (21.5%, 21.5%, and 21.9% in ILS, MET, and PLA, respectively), but was slightly lower for those at risk for DM (19.6%) vs. those with DM (22.7%). There was a significant effect modification by age of the association between the DPP treatment group and DSPN (p<0.05): the odds ratio (OR) for DSPN with ILS vs PLA decreased by 3.7% (95% CI 0.6-6.7) with each 1- year increase in age. MET vs. PLA was not associated with DSPN and age did not influence the null association. In models adjusted for the treatment group, demographics, cardiometabolic risks, and low vitamin B12 or B12 supplement use, DSPN was associated with DM status (OR 1.40, p<0.001 vs. no DM), greater DM duration (OR 1.04 per 1-year, p<0.001), and higher time-weighted HbA1c (OR 1.85 per 1% increase, p<0.001).
The likelihood of DSPN was higher for those with DM, longer DM duration, and higher cumulative glycemic exposure. Although ILS did not prevent DSPN overall, there were ILS benefits with increasing age.
Metabolomic Analyses Identify Novel Predictors of Diabetic Kidney Disease in Youth- Diabetes Youth-Onset Type 2 Diabetes
Diabetic kidney disease (DKD) develops by young adulthood in up to 50% of people with youth-onset type 2 diabetes (Y-T2D), increasing risk of dialysis and premature death. Understanding mechanisms responsible for early DKD is key to management and prevention.
Pyle L and his team identified the metabolite signatures of DKD in Y-T2D and presented the results at the American Diabetes Association (ADA) held in San Deigo, United States between 23rd-26th June 2023.
The study measured 57 metabolites in 374 baseline plasma and urine samples from the Treatment Options for type 2 Diabetes in Adolescents and Youth (TODAY) study, using mass spectrometry with a targeted ZipChip-based assay. The urine albumin-to-creatinine ratio (UACR) was assessed annually for up to 15 years. Incident moderate and severe albuminuria was defined as UACR ≥30 and ≥300 mg/g, respectively, on ≥2 of 3 measures.
The prediction of moderate and severe albuminuria were evaluated in separate Cox proportional hazards models adjusted for HbA1c, triglycerides, systolic blood pressure, and estimated insulin sensitivity. Urine metabolites were normalized by urine creatinine. Participants were 14±2 years of age, 37% male; 43% developed either moderate or severe albuminuria. Four urine metabolites predicted time to moderate albuminuria, while 8 urine metabolites predicted time to severe albuminuria, with 3 metabolites in common: 2- hydroxybutyric acid (moderate: HR: 0.82 per 1 SD [95% CI 0.70, 0.96]; severe: 0.70 [0.55, 0.88]), glycine (moderate: 0.81 [0.69, 0.94]; severe: 0.62 [0.45, 0.85]), citric acid (moderate(moderate: 0.78 [0.67, 0.91]; severe: 0.76 [0.58, 0.99]). Four plasma metabolites predicted time to moderate albuminuria and severe albuminuria, such as glutamic acid for moderate albuminuria (1.23 [1.03, 1.47]) and citric acid for severe albuminuria (1.39 [1.09, 1.77]).
Higher urine metabolites are involved in mitigating oxidative stress (glycine), and glomerular epithelial cell injury (2-hydroxybutyric acid) and preserving mitochondrial function (citrate) predicted lower risk of albuminuria in Y-T2D.
Effectiveness of a Digital, Personalized Lifestyle Program in People with Diabetes in Improving Glycemic Variability and Time in Range—An Urban Indian Real-World Study
Glycemic variability (GV) and Time in range (TIR) are evolving parameters helping people with diabetes (PwD) have better outcomes. The OneCare diabetes program offers CGM- monitored, digital personalized education through CDEs as health coaches and the OneCare app for tracking patient’s behaviour. Sooragonda B presented a study at that evaluated the effectiveness of a digital Personalized Lifestyle program in people with diabetes.
In a 3-month prospective study, enrolled PwD (n=31) were equipped with 14 days of CGM (Abbott freestyle) at the beginning and end of OneCare program. Using 96 daily glucose readings from each patient’s CGM, GV values were obtained from days 2 to 4, of the first sensor (CGM1), and days 12 to 14, of the second sensor (CGM2) ending at day 90. GV was calculated using EasyGV© software. Demographics, HbA1c and glycemic parameters were captured at time points. The health coach guided the progress through weekly calls.
62 evaluable CGM tracings, were included in the study. At 90-day follow-up, HbA1c [%] had decreased by 1.9 from 8.7(1.2) to 6.8(0.8), weight [kg] decreased from 74.1(12.2) to 70.6(10.5), FPG [mg/dl] from 148.13(55.5) to 107.5(20). There were significant improvements seen between the CGM1 vs CGM2 of the GV metrics including %Coefficient Variation {28.52% (8.5); 25.85% (8.2); p=0.02}, Mean Average Glucose [mg/dL] {80.9 (34.4); 62.65 (32.6); (p=<.001)}, Standard deviation of blood glucose {38.76 (14.59); 32.78 (11.2); (p = .01)} and
MAGE {97.78 (31.9); 85.86 (28.68) (mg/dl); (p= .04)}. Significant improvements in TIR (%) were seen on follow up {54.4(21.8); 67.4(20.9)}. The percentage of people achieving the target TIR (>70%) increased significantly from 25.8% to 54.8% (p<0.001). On follow-up, 60%(n=20) of patients required lesser medication for diabetes control.
PwD who participated in OneCare’s CGM-assisted DSME program had definite improvements in GV, TIR along with other metabolic parameters. The results encourage a larger prospective study to validate the findings.