Effect of Smartphone App-Based Intervention on Physical Activity and Glycemic Control in Patients with Type 2 Diabetes: A Randomised Controlled Trial
Oh R, investigated the effects of a physical activity encouragement intervention based on a smartphone personal health record (PHR) application on step count increase, glycemic control and body weight in patients with type 2 diabetes and discussed the results at the European Association for the Study of Diabetes (EASD) Annual Meeting held in Hamburg, Germany on 5th October 2023.
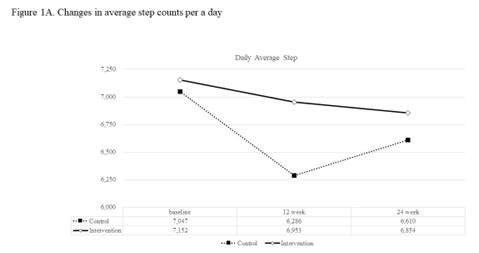
A 12-week, single-center, randomized controlled, and 12-week extension study was carried out with type 2 diabetes patients who were overweight or obese and were randomized to 1:2 to a group using a smartphone personal health record app (control group) or group using the app and received individualized motivational text messages (intervention group) for 12 weeks. Text message interventions were not applied to either group in the extension study conducted during the following 12 weeks. The primary outcome was a change in daily step count after 12 weeks. Secondary outcomes included HbA1c, fasting glucose, and body weight.
200 participants, 62 (93.9%) in the control group and 118 (88.1%) in the intervention group completed the 12-week main study. Change in daily step count at week 12 was -766 ± 3570 for the control and -200 ± 4160 for the intervention group, showing no significance between two groups (P = 0.365). Among subjects with baseline step counts less than 7500 steps per a day, the change in mean daily step count at week 12 in intervention group (1319 ± 3020) was significantly larger than that in control group (-139 ± 2309) (P=0.009). At week 12, HbA1c in intervention group (6.7 ± 0.5%) was significantly lower than that in control group (6.9 ± 0.6%, P=0.041) and at week 24, changes in HbA1c from baseline were significant in both groups but, comparable between groups. Decrease in HbA1c from baseline to week 12 of intervention group was greater in subjects with baseline HbA1c ≥7.5% (-0.81 ± 0.84% to week 12) compared with those with baseline HbA1c <7.5% (-0.22 ± 0.39% to week 12) (P for interaction = 0.014). Significant body weight reduction from baseline to week 24 was seen in both groups without significant between-group differences.
App-based individualized motivational intervention on physical activity showed improvement in step count increment and glycemic control in individuals who were physically inactive or who had baseline HbA1c>7.5% in patients with T2DM.
Improvement in Time in Range After Smart Pen Initiation in Routine Clinical Practice
In 2020, a pilot study conducted in Sweden reported improved glycaemic control following the introduction of a smart insulin pen.
Adolfsson P and the team investigated whether people living with type 1 diabetes or type 2 diabetes (PLWD) on a multiple daily insulin regimen and using a continuous glucose monitoring (CGM) device had an improvement in their glycaemic control after initiating a smart insulin pen for injecting their bolus insulin in routine clinical practice and discussed this at the European Association for the Study of Diabetes (EASD) Annual Meeting held in Hamburg, Germany on 5th October 2023.
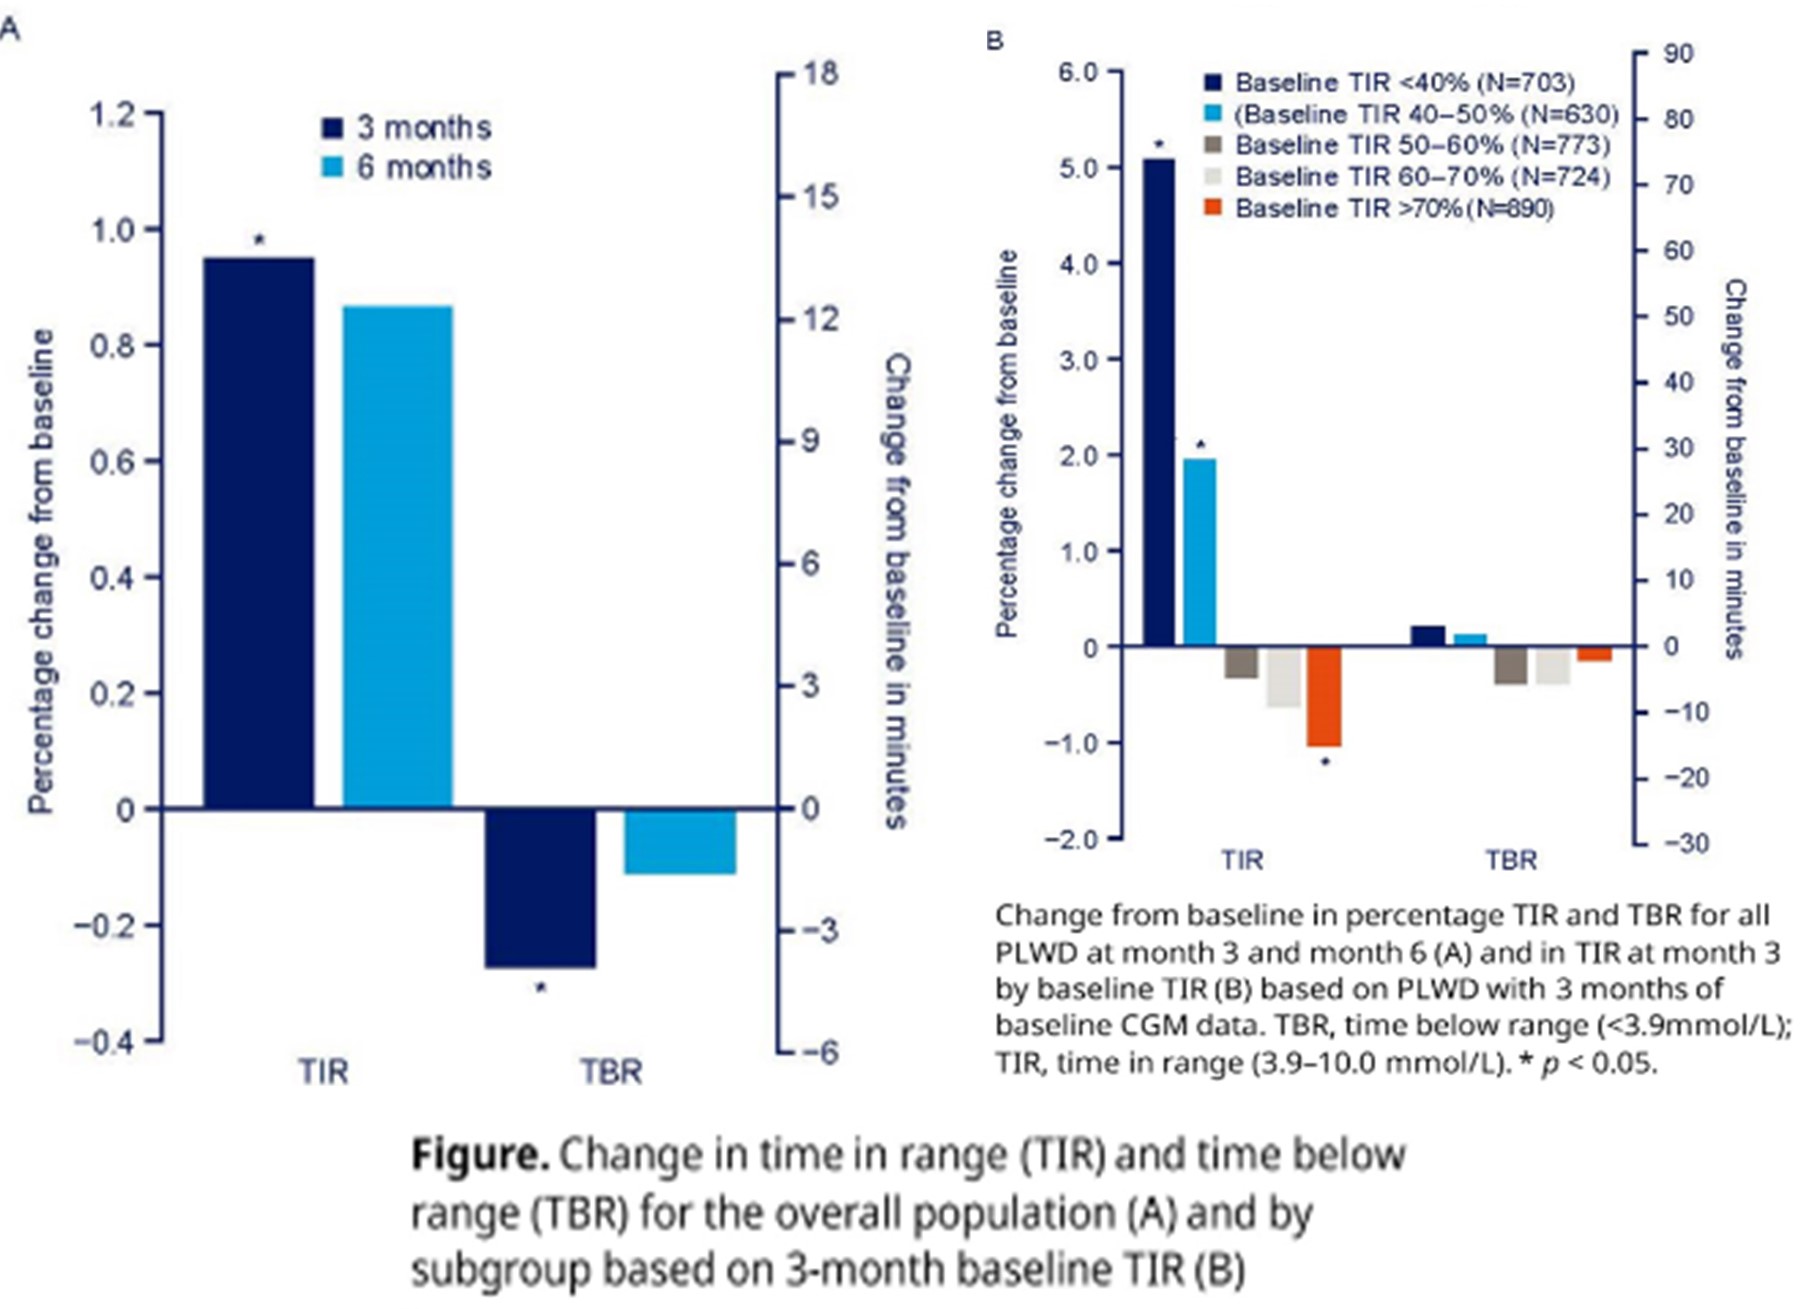
Data were collected from adults (≥18 years) with insulin-treated diabetes who were already using a CGM and started administering bolus insulin using a smart insulin pen (NovoPen 6) together with a CGM app to upload their injection data. PLWD were enrolled from 18 countries. To evaluate only time where the connectivity function of the pen was in active use, days with CGM data were included in the analysis, only if an individual had at least two injection data uploads to an app within the last 14 days. Key glycaemic outcomes included time in range (TIR; 3.9-10.0 mmol/L) and time below range (TBR; <3.9 mmol/L) in the overall dataset and for subgroups by level of baseline TIR for those who had 3 months of baseline CGM data.
Results: Data from 8931 adults were used for the analyses, comprising 580,101 days with CGM data and 221,596 days with recorded injections. The mean age (SD) was 42.2 (15.5). Mean TIR increased 1% from baseline to month 3 (95% CI 0.5, 1.4; p < 0.001) and 0.9% at month 6 (95% CI -0.0, 1.7; p = 0.054). Mean TBR decreased -0.3% from baseline to month 3 (95% CI -0.4, -0.1; p < 0.001) and -0.1% at month 6 (95% CI -0.3, 0.1; p = 0.352). When evaluating outcomes in subgroups based on level of TIR in the 3-month baseline period (N=3720), PLWD with TIR of <40% in this baseline period (N=703) had a significant increase in TIR of 5.1% after 3 months (p < 0.001; Figure). The observed changes in TBR were not significant for any of the subgroups.
Among PLWD initiating a smart insulin pen for their bolus insulin, there was a significant increase in TIR after 3 months, with the greatest improvements seen in those who had the lowest TIR in the baseline period. In addition, there was a significant decrease in TBR after 3 months. Similar changes in TIR and TBR were seen at 6 months but were not statistically significant owing to fewer PLWD having data at this timepoint. Further analysis will be conducted to investigate outcomes over a longer observation period. These real-world data showed that glycaemic outcomes improved after smart insulin pen initiation, especially in those with the highest unmet need. Combining a smart insulin pen with additional support such as app-based training or with education may further improve glycaemic control.
Signs of glucagon resistance after a two-week hypercaloric diet intervention
M.P. Suppli.
Type 1 and type 2 diabetes are characterized by uncontrolled hyperglycemia associated with the progressive failure of pancreatic islet β cells and, ultimately, a reduction in insulin levels. Clinical evidence also demonstrates that elevation of glucagon levels in type 2 diabetes may contribute to the pathogenesis of hyperglycemia by enhancing hepatic glucose output. Hyperglucagonaemia is observed in individuals with obesity and contributes to the hyperglycaemia of persons with diabetes. Hyperglucagonaemia may develop due to impaired hepatic amino acid turnover, which results in elevations of circulating glucagonotropic amino acids. Glucagon resistance and hyperglucagonaemia was recently observed in individuals with obesity and was hypothesised to be a consequence of hepatic steatosis. M.P. Suppli & team evaluated whether glucagon resistance could be induced by a short-term hypercaloric diet intervention designed to increase hepatic fat content in healthy individuals. The findings were presented at the 59th ESAD Annual meeting held from 2nd -6th October 2023 at Hamburg, Germany.
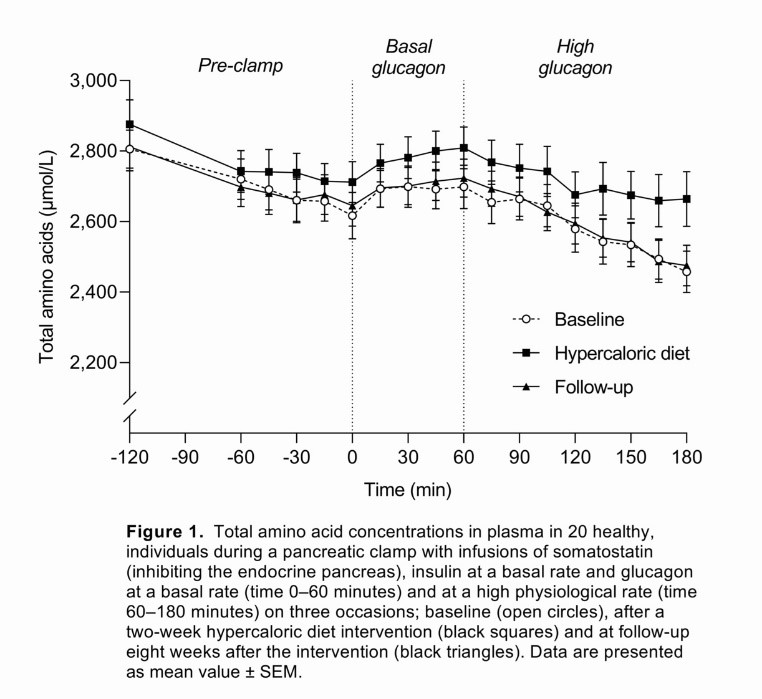
20 healthy, lean individuals (BMI: 23 ± 0.3 (mean ± SD) kg/m2, age: 28 ± 1 years) were recruited to follow a hypercaloric diet (~5,000 kcal/day) and a sedentary lifestyle for two weeks. Amino acid concentrations in response to infusion of high physiological glucagon (4.0 ng/kg/min) were assessed during a pancreatic clamp with somatostatin (450 μg/h) and basal insulin (0.1 mU/kg/min). The participants were examined before and after the intervention and again after eight weeks to assess the reversibility of any metabolic changes. Hepatic steatosis was assessed by magnetic resonance spectroscopy. Data were compared using paired t tests and were adjusted for multiple testing using the method of Benjamini and Hochberg, which controls the false discovery rate.
The intervention led to increases in body weight (3.5 [2.8;4.2] (mean [95% CI]) kg, P < 0.0001) and hepatic fat content (382 [206;705]%, P < 0.001). Insulin resistance was evident with unchanged fasting blood glucose levels and a 56% increase in fasting insulin (P < 0.001). Glucagon infusion led to a decrease in the concentration of total amino acids on all experimental days, but the percentage change in total amino acids was reduced (−2.5 ± 0.5 (mean ± SEM) vs. −0.2 ± 0.7%, P = 0.015) and the average slope of the decline in the total amino acid concentration was less steep (−2.0 ± 0.3 vs. −1.2 ± 0.3 μM/min, P = 0.016) after the intervention compared with baseline (Fig. 1). Body weight remained elevated at follow-up, while all other metabolic changes were normalised.
The author concluded that the study results indicate that short-term unhealthy behaviour, which increases hepatic fat content, causes a reversible resistance to the effect of glucagon on amino acid concentrations in healthy individuals, which may explain the hyperglucagonaemia associated with obesity and diabetes.
Body weight independent effects of CT-868, a signalling biased dual GLP-1_GIP receptor modulator, on glucose homeostasis in overweight and obese adults with type 2 diabetes

M. Hompesch
GLP-1 and GIP can deliver complementary pharmacology when combined. CT-868 is a biased dual GLP-1 and GIP receptor modulator that exhibits no beta-arrestin coupling or receptor internalization at either receptor. M. Hompesch aimed to examine the body weight-independent effects of CT-868 on insulin (INS) secretion via graded glucose infusion (GGI), glucose (GLUC) homeostasis in response to a mixed meal tolerance test (MMTT), gastric emptying (GE) by acetaminophen absorption, and ad libitum food intake (FI), in people with type 2 diabetes (T2D). The findings were presented at the 59th ESAD Annual meeting held from 2nd -6th October 2023 at Hamburg, Germany.
A total of 20 overweight and obese adults with T2D were split into 2 groups: CT-868 vs placebo (PL), n=7 (group 1) and CT-868 vs PL vs liraglutide (Lira), n = 13 (group 2). CT-868 vs PL in both groups 1 and 2 was studied in a randomized, double-blind 2-period crossover fashion, and Lira in group 2 was administered in a fixed 3rd period. Mean age and BMI were 52.2 years and 32.7 kg/m2 with 55% males. Treatments were administered daily for only 4 days to minimize weight loss with a washout of 14 days in between each period.
GGI data showed robust and significantly increased INS secretion for CT-868 vs PL [mean change (SD) in ISR/GLUC at GIRmax: CT-868 1.1(0.1) vs PL 0.1(0.2), p <0.01; Lira 1.0(0.3) pmol/kg/min]. MMTT based GLUC AUC0-240min was significantly reduced for CT-868 vs PL [72(46) vs 392(48) mmol/L*min; p <0.05] and numerically lower vs. Lira [187(55) mmol/L*min]. GLUC lowering was accompanied by significantly decreased INS AUC0- 240min in the CT-868 treated group [1178(846) mU/L*min], versus both PL [5833(873) mU/L*min] and Lira [4613(1253) mU/L*min; p <0.05]. As both CT-868 and Lira had similar delayed GE vs PL, the concomitantly reduced GLUC and INS excursions seen with CT-868 suggests improved INS sensitivity or enhanced INS independent GLUC disposal. CT-868 demonstrated minimal suppression of glucagon during MMTT vs Lira that showed glucagon lowering. Food intake (both absolute amount and total calories) was lower for CT-868 vs PL accompanied by reduction in hunger and appetite scores as assessed by visual analog scales. There were no significant body weight changes in any treatment period, as anticipated by design. The most frequent side effects reported for CT-868 were gastrointestinal (nausea, diarrhea), which were mostly mild and transient. There were no discontinuations in the study due to treatment-related adverse events.
Taken together, these data support a robust weight-independent effect of the fully biased dual GLP-1/GIP modulator CT-868 on glucose disposal with minimal suppression of glucagon, as compared to liraglutide, an unbiased GLP-1 receptor agonist. Further delineation of CT-868’s longer term effects in overweight and obese patients with both T2D and T1D is underway.
Tolerability and effectiveness of gliclazide MR-SGLT2i combination in type 2 diabetes people fasting during Ramadan: a subgroup analysis of the real-world DIA-RAMADAN study
M. Hassanein
Ramadan is a period of religious fasting observed by Muslims during the ninth lunar month of the Islamic calendar and is one of the five pillars of Islam. As the intake of oral antidiabetic drugs (OADs) during daylight hours is forbidden during Ramadan, adequate glycaemic control can be especially challenging for patients with T2DM. Many Muslims with diabetes have an optimistic view of Ramadan and insist on fasting as they perceive the fasting period to be favourable for their health and well-being. The risks associated with fasting, including hypoglycaemia due to decreased food intake during daylight hours, and hyperglycaemia due to reductions in the doses of antidiabetic medications and altered diet, may increase the likelihood of acute complications. Hence, the International Diabetes Federation (IDF) and Diabetes and Ramadan (DAR) International Alliance have developed practical guidelines for the management of DM during Ramadan.
DIA-RAMADAN study was a prospective, observational, international study that explored in real-world settings safety and effectiveness of gliclazide MR in people with Type 2 Diabetes (T2D) fasting during Ramadan. M. Hassanein & team conducted a sub-analysis in the subgroup of patients treated with gliclazide MR combined with a SGLT2i, with or without other oral antidiabetic drugs (OADs). The findings were presented at the 59th ESAD Annual meeting held from 2nd -6th October 2023 at Hamburg, Germany.
The DIA-RAMADAN study enrolled patients across 9 countries in culturally diverse regions: India/Pakistan/Bangladesh, Egypt/Kuwait/UAE/Saudi Arabia, Indonesia/Malaysia. Data were collected during Ramadan 2019. Main eligibility criteria were adult T2D patients treated at stable doses with gliclazide MR for >90 days prior to enrolment. Patients requiring insulin and with HbA1c ≥9% were excluded. Patients were examined at inclusion (V0) 6-8 weeks before Ramadan. Patients remained on Gliclazide MR once daily for 14-18 weeks. A second visit (V1) was conducted 4-6 weeks after Ramadan. Main study outcomes were the proportion of patients reporting ≥1 confirmed hypoglycemia event (HE), changes in HbA1c and body weight. Changes pre- to post-Ramadan were analyzed using paired t-tests or Wilcoxon tests. Adherence (%) was calculated as (sum of number of intakes taken during Ramadan/sum of number of intakes to be taken during Ramadan) x 100.
Of 1214 patients included, 102 received a gliclazide MR-SLGT2i based therapy. These patients were in average younger (mean ± SD: 51.4 ± 10.4 years vs 54.3 ± 10.4 years, respectively), with longer disease duration (5.8 ± 4.5 years vs 5.4 ± 5.7 years), higher HbA1c (7.7 ± 1.0% vs 7.5 ± 0.9%) and had more comorbidities (hypertension 58.8% vs 33.7%, dyslipidemia 51.0% vs 26.8%) compared to those not receiving the combination. Adherence to the combination therapy was ≥80% in 95.1% of patients. Most patients were treated with ≥3 OADs (92.2%). 4/102(3.9%) patients reported ≥1 confirmed HE and no severe HEs were reported. No patient broke his fast due to hypoglycemia. A significant reduction in HbA1c (-0.6 ± 1.0 %; p<0.001) and body weight (-0.6 ± 5.9 kg; p<0.001) was observed between V0 and V1.
The author concluded that this sub-analysis of the DIA-RAMADAN study suggests that the combination of gliclazide MR with a SGLT2i is a well-tolerated and effective treatment option for patients with Type 2 Diabetes who are fasting during Ramadan. The study found a low incidence of hypoglycemic events and significant reductions in HbA1c and body weight. These findings in real-life settings provide important insights into the management of T2D during Ramadan and could inform clinical practice in this population.
Risk of diabetic microvascular complications, heart failure, hospitalisation and all-cause mortality with SGLT2i and GLP1-ra in type 2 diabetes- a real-world data study
A. Eleftheriadou
The management of type 2 diabetes has included targeting multiple metabolic pathways to achieve optimal glycaemic control. Inhibitors of the sodium-glucose cotransporter 2 (SGLT2i) and glucagon-like peptide-1 receptor agonists (GLP-1 RA) have been studied and trialled in type 2 diabetes with an overwhelming body of evidence supporting their use in type 2 diabetes. A. Eleftheriadou & team assessed the relationship of sodium-glucose cotransporter-2 inhibitors (SGLT2i) and glucagon-like peptide-1 receptor analogues (GLP1-ra) on 5-year risk of diabetic neuropathy, autonomic neuropathy, diabetic retinopathy and macular oedema, hospitalisation and all-cause mortality in type 2 diabetes. The findings were presented at the 59th ESAD Annual meeting held from 2nd -6th October 2023 at Hamburg, Germany.
This was a retrospective cohort analysis of six million people with type 2 diabetes across 85 healthcare organisations using a global federated health research network (TriNetX, Boston, USA). Two intervention cohorts (SGLT2i, n=126,171 ; GLP1-ra, n=164,024 ) were compared against a control cohort (no SGLT2i/ GLP1-ra, n=1,665,412 ). Propensity score matching for age, sex, ischaemic heart disease, microvascular complications, HbA1c <7% and ³7%, and use of pioglitazone was used to balance cohorts 1:1. A sub-analysis comparing the two intervention cohorts was also performed.
Intervention cohorts (both SGLT2i and GLP1-ra) demonstrated a reduced relative risk (RR, 95% confidence interval [95%CI]) compared to the control cohort at 5 years for macular oedema (SGLT2i: 0.55, 0.51-0.59. GLP1-ra: 0.80, 0.76-0.84), heart failure (SGLT2i: 0.55, 0.54-0.57. GLP1-ra: 0.63, 0.61-0.65), hospitalisation (SGLT2i: 0.64, 0.64-0.65. GLP1-ra: 0.65, 0.65-0.66) and all-cause mortality (SGLT1i: 0.38, 0.37-0.40. GLP1-ra: 0.39, 0.38- 0.40). Contrary to the GLP1-ra cohort, the SGLT2i cohort demonstrated a reduced risk compared to the control cohort at 5 years for diabetic neuropathy (SGLT2i: 0.86, 0.84-0.89. GLP1-ra: 1.19, 1.16-1.22), autonomic neuropathy (SGLT2i: 0.83, 0.76-0.92. GLP1-ra: 1.08, 1.00-1.17) and diabetic retinopathy (SGLT2i: 0.71, 0.67-0.74. GLP1-ra: 1.06, 1.02-1.10). When directly comparing to SGLT2i, the GLP1-ra cohort demonstrated an increased RR at 5 years in neuropathy (1.42, 1.39-1.47), autonomic neuropathy (1.28, 1.17-1.40), diabetic retinopathy (1.48, 1.41-1.55), macular oedema (1.49, 1.38-1.60), heart failure (1.16, 1.12-1.20), hospitalisation (1.04, 1.03-1.06) and all-cause mortality (1.09, 1.06-1.13).
The author concluded that SGLT2i and GLP1-ra both reduce the risk for macular oedema, heart failure, hospitalisation and all-cause mortality in people with type 2 diabetes over 5 years. Additionally, SGLT2i therapy reduced the risk for further microvascular complications including neuropathy, autonomic neuropathy and retinopathy. SGLT2i therapy was associated with the greatest risk reduction in diabetic microvascular complications as well as heart failure, hospitalisation and all-cause mortality. Future randomised controlled trials of SGLT2i and GLP1-ra should incorporate sensitive surrogate biomarkers of diabetic microvascular disease to validate these findings and if validated, in particular SGLT2i should be considered higher in the treatment algorithm for the general patient with type 2 diabetes.
Incidence of type 2 diabetes with verapamil treatment compared with other calcium channel blockers
J.W. Sacre
Approximately 537 million people globally suffer from type 1 (T1D) and type 2 diabetes mellitus (T2D) and prevalence of both is substantially increasing [1,2]. Without sufficient action to address this situation, the number of people suffering from diabetes is predicted to be 643 million in 2030 [2]. The key factor in developing T1D and advanced T2D is the loss or impairment of the insulin-secreting β-cells of the pancreas. Type 1 diabetes, an autoimmune condition resulting in the destruction of insulin-producing pancreatic beta cells, affects more than 1 million people in the US. Maintenance of even modest residual beta cell function, which is assessed by stimulated C-peptide secretion, is a desirable goal and is associated with lower risk of diabetes-related vascular complications and hypoglycemia. Calcium channel blockers, such as verapamil, reduce thioredoxin-interacting protein expression and beta cell apoptosis and may be beneficial in beta cell preservation after a type 1 diabetes diagnosis. Preserving β-cells function is one of the principle aims in the treatment of T2D to delay the natural course of the disease, necessitating the introduction of insulin therapy in the majority of patients. Recent evidence that the calcium channel blocker (CCB) verapamil preserves beta cell function in type 1 diabetes raises the prospect of a role for this medication in prevention of type 2 diabetes. J.W. Sacre & team compared type 2 diabetes incidence between verapamil versus other CCB users in a large cohort of Australians without diabetes. The findings were presented at the 59th ESAD Annual meeting held from 2nd -6th October 2023 at Hamburg, Germany.
Among ~2 million Australians without diabetes registered on the Pharmaceutical Benefits Scheme (PBS), the team identified 345,285 CCB-treated individuals (≥2 supplies) aged ≥40 years during the period 2002-2014. Incident type 2 diabetes was captured via linkage to the National Diabetes Services Scheme (NDSS). Individuals were followed from the date of their first CCB supply until onset of diabetes, death, age 90 years, or end-2014. Hazard ratios (HR) and 95% CIs for the relationship between verapamil versus other CCBs and incident type 2 diabetes were estimated via Cox regression using age as the time scale and adjusted for sex, area-based socioeconomic status, and medication use (ACE inhibitor/angiotensin receptor blocker, beta-blocker, diuretic, lipid-lowering, and antiplatelet therapy).
Participants were aged 69 ± 9 years at study entry (50% women), and 38,989 (11%) were treated with verapamil. During a median follow-up of 6.4 years, 24,061 individuals developed type 2 diabetes. The overall adjusted HR for incident type 2 diabetes with verapamil treatment compared with other CCBs was 0.94 (0.91-0.98). However, interaction testing revealed subgroup differences according to baseline beta-blocker use, whereby verapamil was associated with lower incidence of type 2 diabetes in the setting of beta-blockade (HR 0.81 vs. 0.96 in those without beta-blockade; p<0.05). Similar results were observed in two sensitivity analyses: i) when verapamil was compared with dihydropyridine CCBs only; and ii) when the cohort was restricted to individuals treated with at least one other antihypertensive drug.
The author concluded that Verapamil may be associated with lower incidence of type 2 diabetes compared with other CCBs. Further research is warranted to clarify its potential to reduce type 2 diabetes risk in certain clinical settings.
Effect of ertugliflozin on body weight and HbA1c by baseline BMI: observations from VERTIS CV
F. Cosentino
Type-2 diabetes (T2D) has a well-known association with obesity and cardiovascular diseases (CVDs). Obesity-related insulin resistance leads to the development of T2D which, together with obesity, serves as a major risk factor for developing CVDs. Furthermore, CVDs contribute to two-thirds of all the T2D-related deaths. Sodium−glucose cotransporter 2 inhibitors are associated with body weight (BW) lowering and improved glycaemic control. F. Cosentino & team analysed data from VERTIS CV to study the effect of ertugliflozin (ERTU) on BW lowering and glycaemic control according to baseline BMI. The findings were presented at the 59th ESAD Annual meeting held from 2nd -6th October 2023 at Hamburg, Germany.
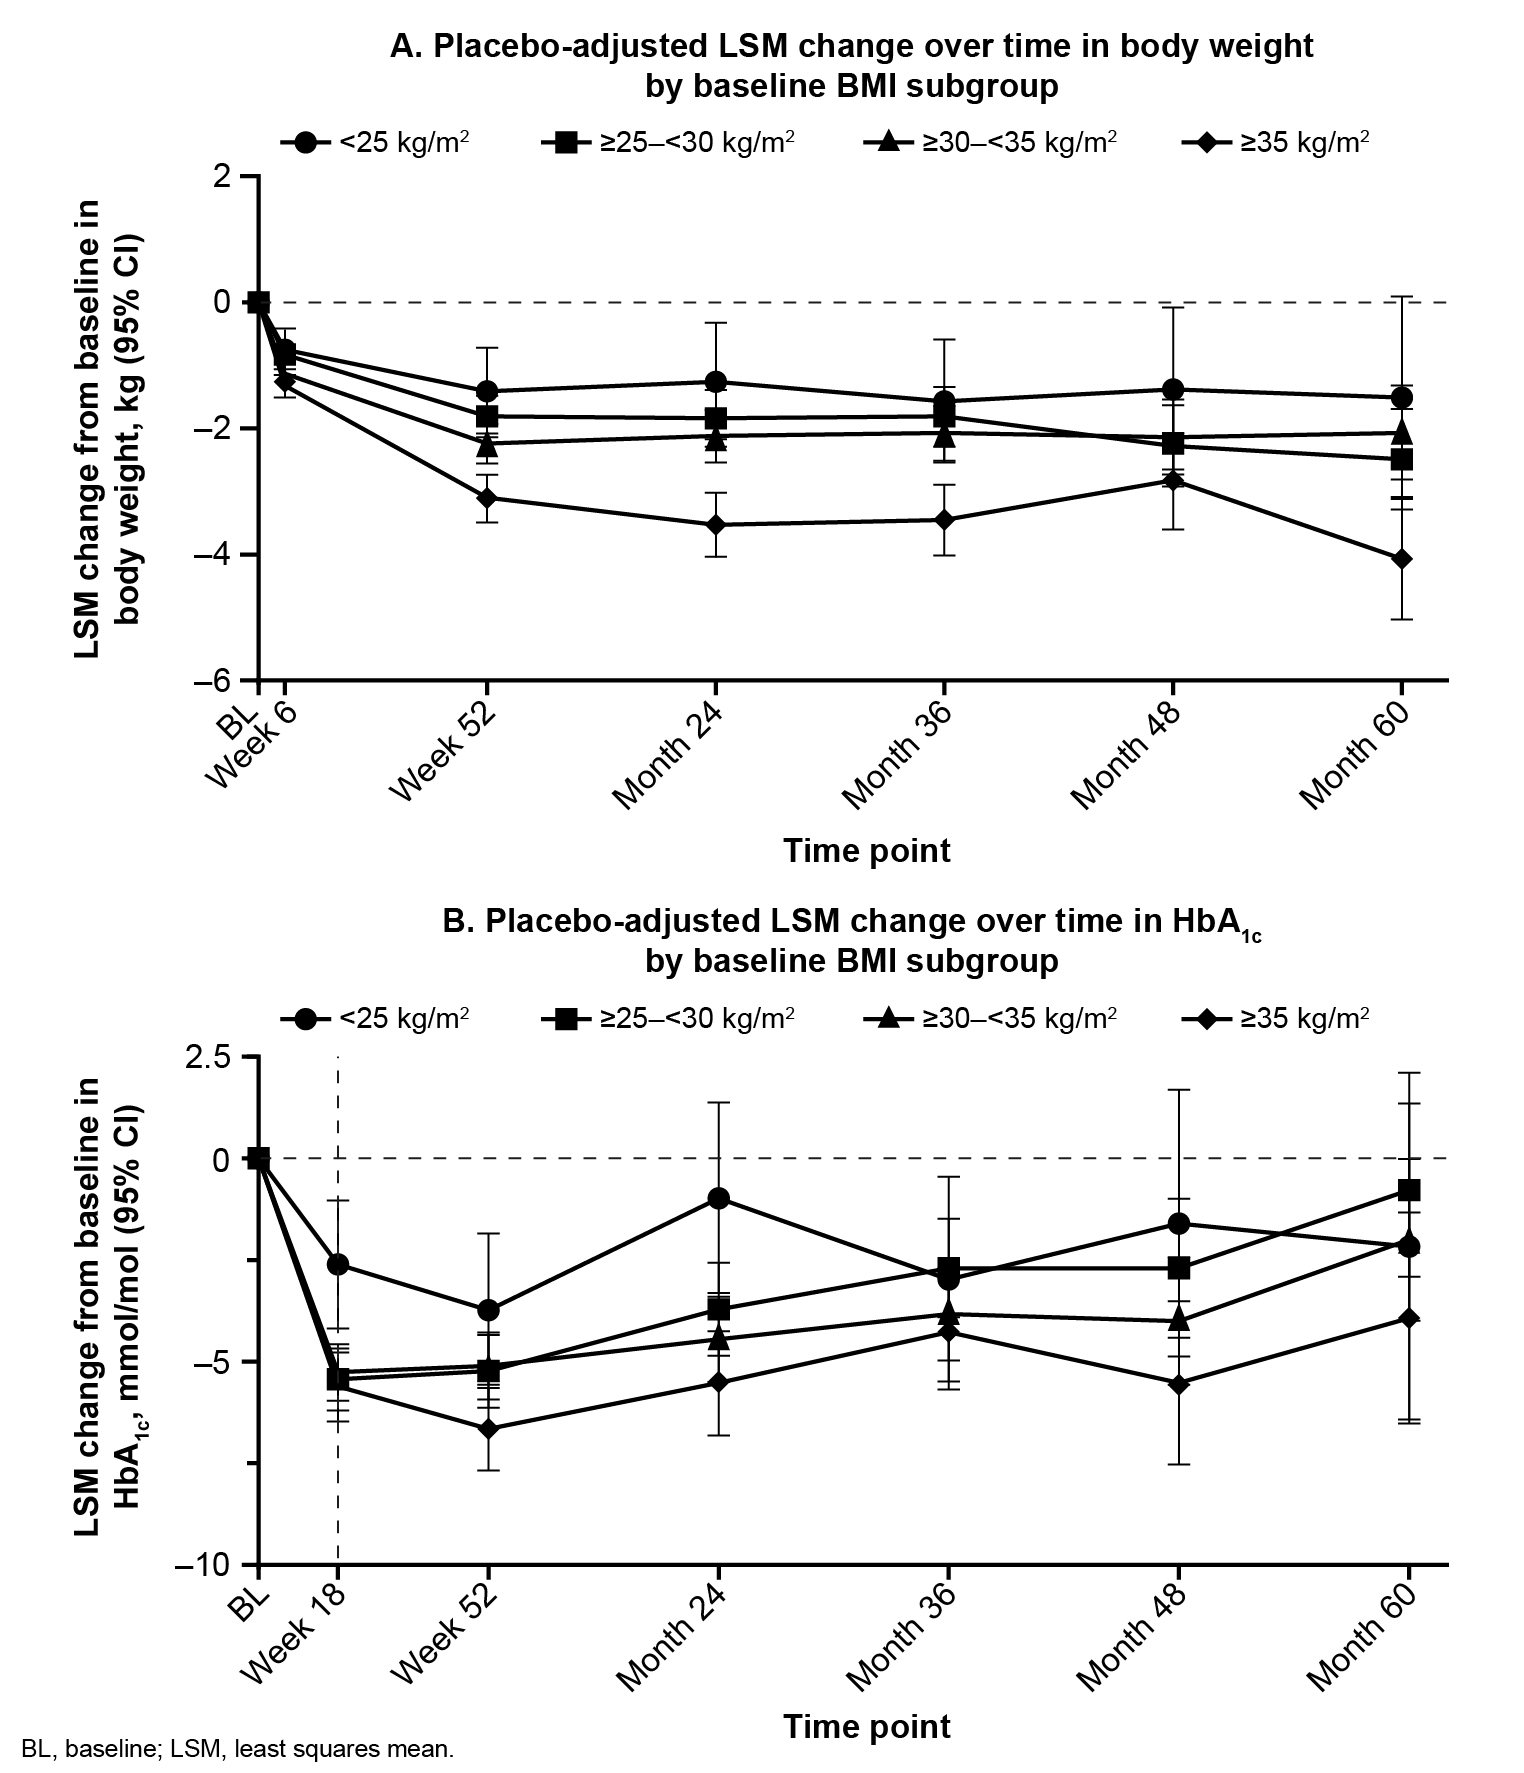
Patients with type 2 diabetes and atherosclerotic CVD were randomised (1:1:1) to ERTU 5 or 15 mg (doses pooled for analyses) or placebo (PBO). Changes to background antihyperglycaemic agents were not permitted during the first 18 weeks, except when participants met predefined glycaemic rescue thresholds or experienced clinically significant hypoglycaemia. In these post hoc analyses, changes in BW and HbA1c over time by baseline BMI (<25 kg/m2, ≥25—<30 kg/m2, ≥30—<35 kg/m2 and ≥35 kg/m2) were assessed using an ANCOVA model that adjusted for baseline, treatment, time, baseline HbA1c (for the analysis of changes in BW), baseline eGFR (continuous), BMI subgroups, treatment-by-subgroup and treatment-by-subgroup-by-time interaction.
In the BMI <25, ≥25—<30, ≥30—<35 and ≥35 subgroups, there were 391 (7.1%), 1741 (31.7%), 1995 (36.3%) and 1369 (24.9%) patients treated with ERTU and 210 (7.6%), 836 (30.4%), 1009 (36.7%) and 692 (25.2%) patients treated with PBO, respectively. In the BMI <25, ≥25—<30, ≥30—<35 and ≥35 subgroups, mean (SD) BWs (kg) at baseline were 65.8 (9.7), 80.3 (9.6), 93.1 (11.0) and 111.7 (17.3) in patients treated with ERTU and 65.7 (8.7), 80.8 (9.7), 93.5 (11.5) and 110.8 (16.8) in patients treated with PBO, respectively. Baseline characteristics were well balanced between treatment groups within each BMI subgroup including the baseline HbA1c across all groups of ~66 mmol/mol. In the BMI <25, ≥25—<30, ≥30—<35 and ≥35 subgroups, PBO-adjusted least squares mean (95% CI) changes in BW (kg) from baseline to Month 60 were −1.51 (−3.09, 0.08), −2.49 (−3.29, −1.69), −2.07 (−2.81, −1.32) and −4.07 (−5.02, −3.12), respectively (Fig. 1A). In the BMI <25, ≥25—<30, ≥30—<35 and ≥35 subgroups, PBO-adjusted least squares mean (95% CI) changes in HbA1c (mmol/mol) from baseline to Week 18 were −2.61 (−4.16, −1.06), −5.43 (−6.19, −4.68), −5.26 (−5.96, −4.57) and −5.61 (−6.45, −4.77), respectively (Fig. 1B).
The author concluded that treatment with ERTU was associated with BW loss and improved glycaic with PBO across BMI subgroups. Greater reductions in BW and HbA1c were observed in patients with a higher BMI than those with a lower BMI.
Cardiorenal outcomes among people with diabetes and chronic kidney disease in the French CKD-REIN cohort: influence of the achievement of therapeutic goals at baseline
F. Bonnet
Globally, the incidence and prevalence of diabetes mellitus has risen dramatically, owing mainly to the increase in type 2 diabetes mellitus (T2DM). One of the most frequent and severe long-term complications of diabetes is diabetic kidney disease (DKD), defined as chronic kidney disease in a person with diabetes. Chronic kidney disease (CKD) in patients with type 2 diabetes (T2D) represents a major public health problem and accounts for most patients with end-stage kidney disease (ESKD) worldwide. Despite current standard-of-care therapies, a disproportionately high burden of cardiovascular disease (CVD) and ESKD exists in this population, accounting for high morbidity, mortality, and healthcare resource use and poor health-related quality of life. Lifestyle modification, optimization of glycemic and blood pressure control, statins, and the use of angiotensin-converting enzyme inhibitors/angiotensin receptor blockers have been the cornerstone of treatment for patients with CKD and T2D for several decades; however, substantial residual disease burden of CVD and ESKD remains even in optimally managed patients.
F. Bonnet & team studied whether the achievement of a combination of therapeutic goals at baseline (urinary albumin creatinine ratio (UACR) <300 mg/g, HbA1c <7.0 %, blood pressure <130/80 mmHg, renin-angiotensin system inhibition) is protective of cardiorenal outcomes and all-cause mortality in people with diabetes and chronic kidney disease (CKD). The findings were presented at the 59th ESAD Annual meeting held from 2nd -6th October 2023 at Hamburg, Germany.
CKD-REIN is a 5-year cohort prospective study of 3033 French adults with stages 3-5 CKD, recruited with a national representation. The team studied the 1260 people (31% women) with diabetes: mean age 70 ± 10 years, mean eGFR 33 ± 11 ml/min/1.73 m2 and a median 4-year follow-up. Incident cardiorenal outcomes, defined by end stage renal disease (ESRD) or MACE 4 (cardiovascular death, myocardial infarction, stroke, hospitalization for heart failure) and total mortality were studied using Cox regression models.
Cardiorenal outcomes were inversely associated with the number of therapeutic goals achieved at baseline: 35, 18, 12 and 8.7 per 100 person years for zero, 1, 2 and ≥3 criteria respectively. UACR <300 mg/g was the criteria the most strongly associated with improved prognosis. Hazard ratios (95% CI) after adjustment for eGFR and other confounding factors were: In the subgroup with elevated albuminuria (>300 mg/g), achievement of at least 2 of the other 3 goals was also associated with improved prognosis, compared to those who had none.
The author concluded that people with diabetes and CKD stages 3-5 who achieved two or more therapeutic goals have improved cardiorenal outcomes and mortality, even in presence of elevated albuminuria.
Need for newer pillars of therapy for reno-protection: pronounced eGFR slope improvement by SGLT2i and GLP-1RA in people with rapid eGFR decline
K. Kashima
Prevention of end stage renal disease (ESRD) is one of the priorities in the diabetes management. Especially in people with fast eGFR decline, once eGFR rapidly declines, it steadily progresses to ESRD in 2 to 10 years. Earlier detection and intervention are important. Since heterogeneity exists in individual eGFR declining rate and responsiveness to reno-protective therapy, changes in distribution of annual eGFR decline and reno-protective effects by GLP-1RA to SGLT2i were assessed by K. Kashimain & team in Japanese people with type 2 diabetes (T2D) with chronic kidney disease (CKD) by tracing individual eGFR trajectories. The findings were presented at the 59th ESAD Annual meeting held from 2nd -6th October 2023 at Hamburg, Germany.
A total of 75 people with T2D with advanced CKD stage 3-4, treated by SGLT2i (empagliflozin 65% and others) were analyzed. The duration of diabetes at the time of recruitment (70.3±12.2 year-old) were as follows: stage 3a (n=29); 11.9±5.4 yrs, stage 3b (n=28); 19.9±12.1 yrs, and stage 4 (n=18); 13.8±8.5 yrs. To trace the eGFR trajectory in each person, most rapid eGFR slope was calculated individually from the data for 46±20 months before using SGLT2i and 48±17 months after adding it. GLP-1RA was initially or additionally used in 53%. Observation period has extended from the previous study. GLP-1RA (liraglutide 93% and others) was used in 41%, 71% and 44% respectively based on individualized treatment.
1) In total, SGLT2i decreased eGFR from 46.1±14.1 to 43.6±13.5ml/min/1.73m2 (P<0.001) at first month after initiation. 2) The baseline distribution of the most rapid eGFR declining rate was varied from -66.2 to +0.7mL/min/1.73m2/year. Slopes in the most serious rapid decliners (defined as most rapid individual eGFR slope greater than -10.0ml/min/1.73m2/y) (13/75) were remarkably improved from -18.9±16.4 to -1.3±3.2ml/min/1.73m2/year (P<0.01) by combined use of GLP-1RA in 85% (11/13). On the background characteristics, these rapid decliners had macro-albuminuria in 69% (9/13) and nephrosis in 54% (7/13). In one female person with nephrosis, eGFR slope was improved from -39.0 to -3.8mL/min/1.73m2/y after adding liraglutide 0.9mg, then after adding empagliflozin 10mg to +0.52 mL/min/1.73m2/y for next 62months. 3) Sub-divided into non-responder and responder (responder: defined as slope are attenuated vs baseline), the rate of responders in each stage were as follows: stage 3a; (21/29), stage 3b; (22/28), stage 4; (16/18). Slopes in responders (59/75) were improved as follows, -7.7±9.8 to -0.9±2.9 mL/min/1.73m2/year (P<0.001), combined with GLP-1RA in 52.5%. Responders were more rapid eGFR decliners and highly had macro-albuminuria (52.5% vs 37.5%). Slopes in non-responders (16/75) were worsened as follows, -1.7±1.9 to -3.6±3.2mL/min/1.73m2/year (P<0.001), despite combined use of GLP-1RA in 56.3%. Although baseline eGFR declining rate was faster in responders, it was greatly improved by SGLT2i±GLP-1RA. As a result, the improvement of the distribution of eGFR decline was more pronounced in the fast decliners. 4) Slopes were improved in all stages, stage 3a: -4.1±3.7 to -1.1±3.2 (P<0.001) and stage 3b; -5.0±3.6 to -1.4±3.0 (P<0.001), and stage 4; -12.4±16.3 to -2.1±3.5mL/min/1.73m2/year (P<0.01). The magnitude of improvement in eGFR decline was greater in stage 4.
The author concluded that it is important to assess individual eGFR trajectory for reno-protection. Newer pillars of therapy, GLP-1RA in addition to SGLT2i must be useful to prevent ESRD in people with diabetes with rapid eGFR decline.