J Am Coll Cardiol. 2019 Dec,74(24):2982-2994.
Gudbjartsson DF, et al., demonstrated a study if cardiovascular risk is presented by Lipoprotein(a) [Lp(a)] molar concentration or apolipoprotein ([apo(a)] size, and if there the link between Lp(a) and type 2 diabetes (T2D) risk is spontaneous.
This study represents a case-control study of almost 143,087 Icelanders along with genetic details, which includes 17,715 with coronary artery disease (CAD) and 8,734 with T2D.
Measured and genetically assigned Lp(a) molar concentration, kringle IV type 2 (KIV-2) replicate (which demonstrate apo(a) size), and a link derived in LPA correlated with small apo(a) low Lp(a) molar concentration was utilized in this study to simplify the link between Lp(a) and cardiovascular risk. Loss-of-function homozygotes and other subjects genetically predicted to have low Lp(a) levels were estimated to analyse the link between Lp(a) and T2D.
Greater risk of coronary artery disease (CAD) has been linked with greater Lp(a) molar concentration and lower apo(a) isoforms. These are conversely associated characteristics of the Lp(a) particle (Figure 1). Loss-of-function variants are appropriate devices for Mendelian randomization because homozygotes and compound heterozygotes for the loss-of-function mutations (1 in 260 individuals) always shows lesser Lp(a) molar concentration (median molar concentration: 2.0 nM, highest observed: 3.4 nM) (Figure 2). As G4925A carriers produce Lp(a), it is not a loss-of-function mutation (Figure 2). Accordingly, G4925A provides a second Mendelian randomization device for evaluating if Lp(a) molar concentration or apo(a) size is leading the CAD correlation because carriers possess both short apo(a) isoforms and Lp(a) molar concentrations that are near to that of individuals who have long KIV-2 repeats. A correlation was observed between Lp(a) molar concentration with non-high-density lipoprotein (non-HDL) cholesterol levels. Although, the odds ratio (OR) of CAD shows nearly 1.15 per 50 nM Lp(a) rise in molar concentration (p < 0.0001) which was much higher than the expected rise in risk rely on the non-HDL cholesterol correlation (Figure 3). Hence, the correlation of the non-HDL and Lp(a) molar concentration fails to report for its strong CAD correlation. The 10% of participants with lesser Lp(a) molar concentration (<3.5 nM) were stated to be at higher risk of T2D (Figure 3). Thus, Molar concentration is the feature of Lp(a) that may have an impact on the risk of cardiovascular diseases. Low Lp(a) concentration (bottom 10%) elevates the risk of T2D. Pharmacologic decline in the Lp(a) concentration in the 20% of participants with a higher concentration down to the population median is expected to reduce CAD risk without raising the risk of T2D.
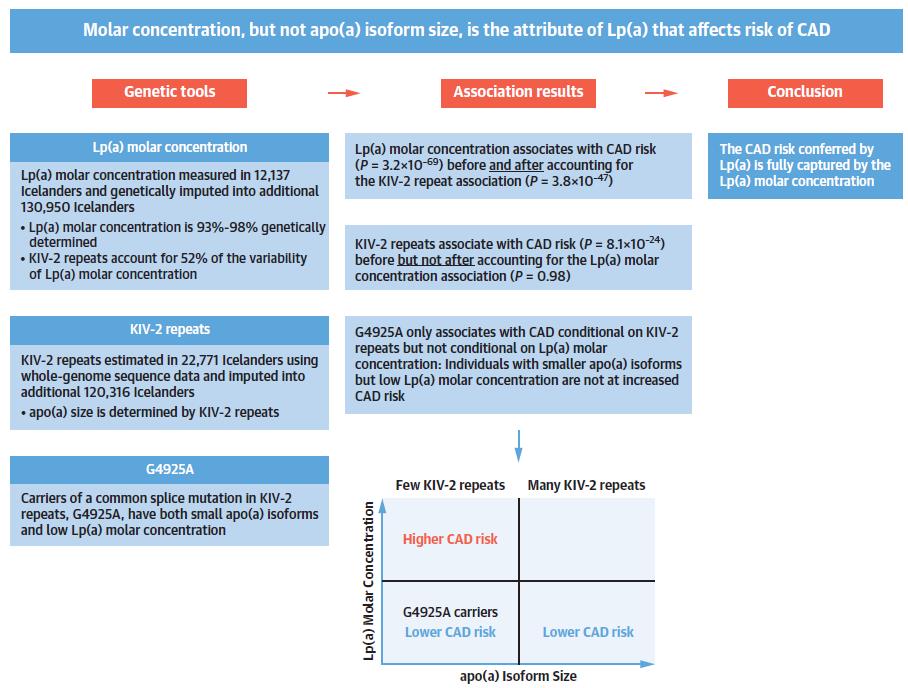
Figure 1: Determination of the Relationship Between Lp(a) Molar Concentration, apo(a) Isoform Size and Cardiovascular Risk
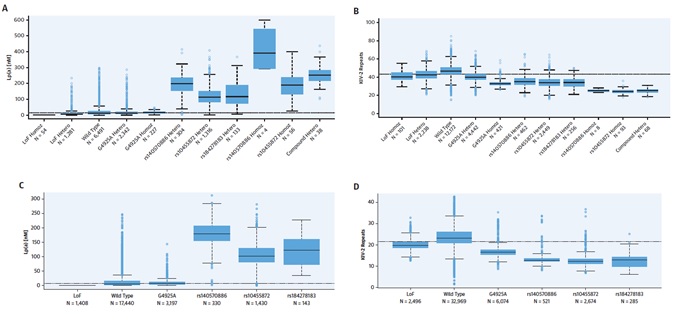
Figure 2: Lp(a) Molar Concentration and KIV-2 Repeats by SNP Genotype and Allele; (A) Lp(a) molar concentration by single nucleotide polymorphism (SNP) genotype and (C) allele. KIV-2 repeats by (B) SNP genotype and (D) allele. Lp(a) molar concentration was measured in 12,137 subjects and KIV-2 repeats were measured using whole-genome sequencing in 22,771 subjects. The bottom, middle, and top of the boxes indicate the first, second (median), and third quartile, the whiskers indicate 1.5 times the interquartile range or the minimum/ maximum values if the outlying values lie within this range. Observations outside 1.5 times the interquartile range indicated with points. Haplotype sharing was used to deconvolute the allelic effects of the SNPs. Hetero: heterozygous carriers; Homoz: homozygous carriers; LoF: loss-of-function variants.
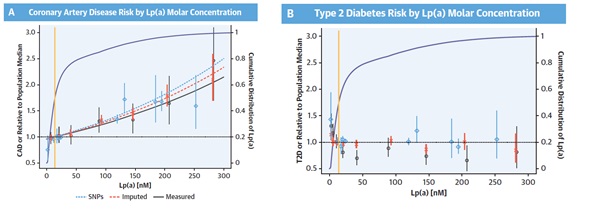
Figure 3: A) Coronary artery disease (CAD) risk and (B) type 2 diabetes risk (T2D) by lipoprotein(a) [Lp(a)] molar concentration, expressed as odds ratios (OR) relative to the population median. The whiskers indicate 95% confidence intervals. The yellow line shows the median Lp(a) level. The purple curve shows the cumulative distribution of Lp(a) levels (see right y-axis for scale). The blue diamonds indicate Lp(a) single nucleotide polymorphism (SNP) genotype effects (see Figure 1). The red x indicates the CAD and T2D risk relative to the estimated risk of individuals with the population median Lp(a) molar concentration versus genetically imputed Lp(a) molar concentration split into bins at 0, 15, 30, 60, 120, 180, and 240 nM. The black circles indicate the same, but for measured Lp(a) molar concentration. (A) Dotted blue, dashed red, and solid black lines indicate the logistic regression fit of CAD risk as a function of Lp(a) measured by SNP effect, mean genetically imputed Lp(a) molar concentration, and mean measure Lp(a), respectively, adjusted for sex and first- and second-order terms for year of birth.