Opoku S, et al. BMC Public Health. 2019 Nov 11;19(1):1500.
Opoku S, et al., conducted a study to demonstrate the prevalence and correlated risk factors of dyslipidemia – raised total cholesterol (TC), raised triglycerides (TG), raised low-density lipoprotein (LDL-C), low high-density lipoprotein (HDL-C), and raised non-high-density lipoprotein (non- HDL-C) in rural and urban China.
Data were estimated from almost 136,945 subjects aged 40–100 years in the CNSSPP project for 2014. Overall details on demographic, metabolic and lifestyle characteristics were utilized. By using Chi-square tests and multivariable logistic regression, age- and sex-adjusted prevalence and risk factors for dyslipidemia among participants were collected.
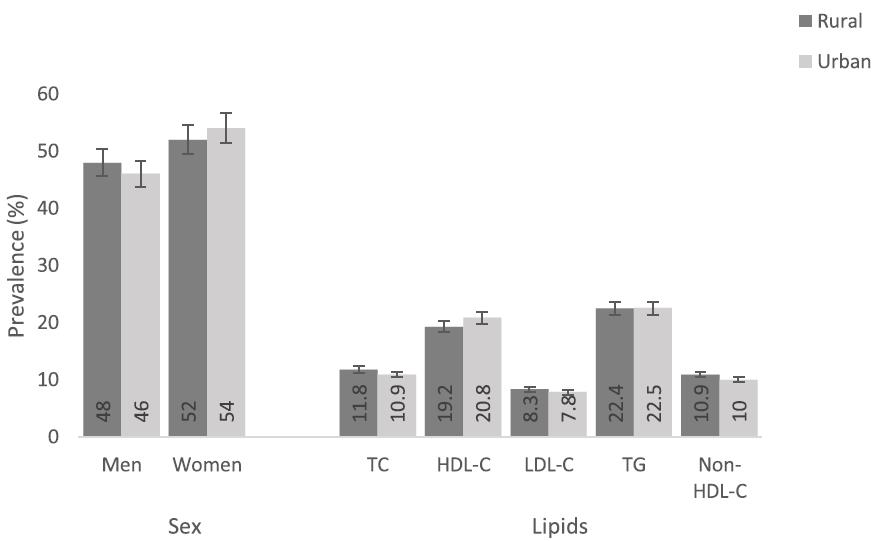
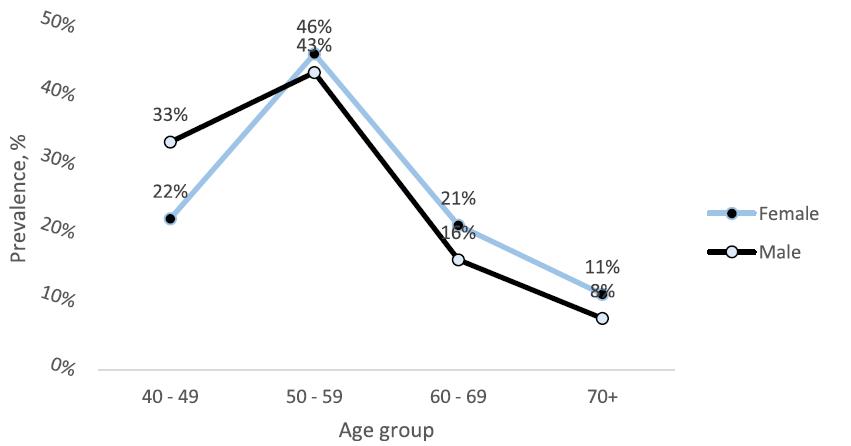
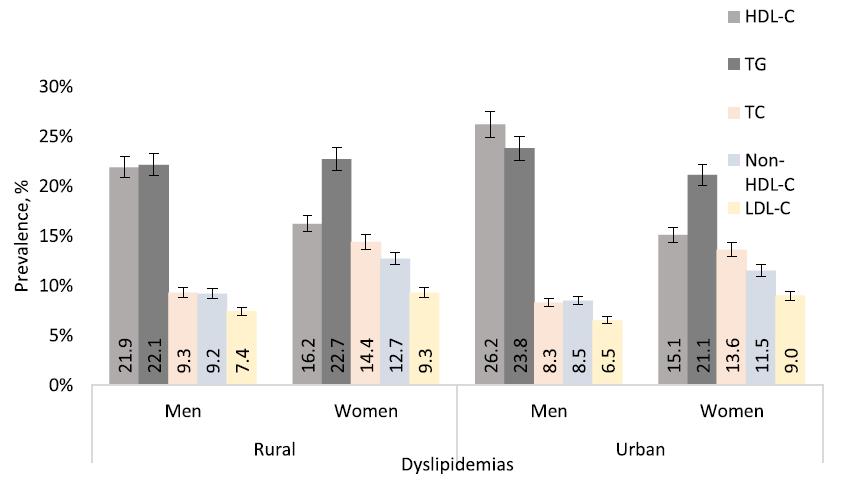
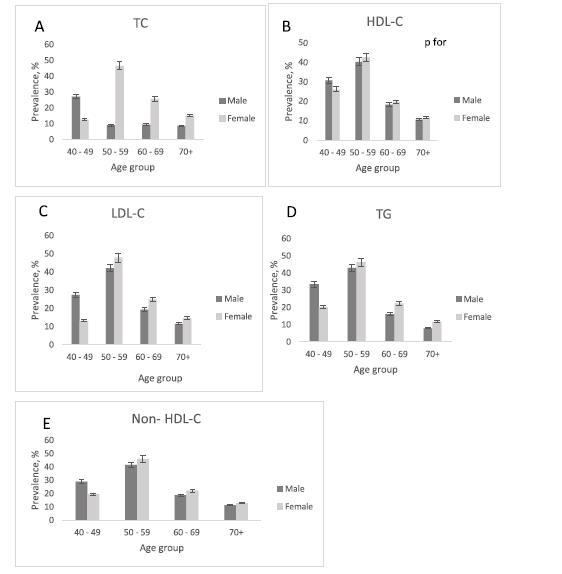
The prevalence of dyslipidemia between rural (43.2%) and urban (43.3%) participants was found to be similar. Women shows higher prevalence of dyslipidemia in both areas of residence as compared with men (rural: 52.0% vs. 48.0%, urban: .2 54.0% vs. 46.0%; p for < 0.001). With respect to the components of dyslipidemia: urban vs. rural subjects shows higher prevalence of low HDL-C (20.8% vs. 19.2%), while the prevalence of raised LDL-C (7.8% vs. 8.3%), raised TC (10.9% vs.11.8%) and raised non-HDL-C (10.0% vs. 10.9%) was found to be lesser in urban residents, (all p < 0.001) (Figure 1). Higher prevalence of 33% dyslipidemia was observed in men below age 50 as compared to 22% with women. Subsequently, reduction was observed in prevalence in both sexes, but women shows higher prevalence values than men (p < 0.05) (Figure 2). As compared to men in rural settings, all lipid abnormalities were observed significantly higher among women (p for χ2 < 0.001) excluding low HDL-C. In the same way, higher levels for raised TC, raised LDL-C and raised non-HDL-C (p for χ2 < 0.001) was observed among urban women. Whereas, as compared with women, high levels for low HDL-C and raised TG was observed among urban men (26.2% vs. 16.5% and 23.8% vs. 21.1%; p for χ2 < 0.001), respectively (Figure 3). According to sex and age groups, the prevalence of the five components of dyslipidemia was shown in Figure 4. Among all the components, similar prevalence patterns were observed. The prevalence patterns rises and lowers with ageing, and was significantly different as observed between men and women (p value from χ2 < 0.001). The prevalence reached at high point at aged 50–59 years and dropped afterwards (Figure 4).
Thus it was concluded that low HDL-C was found to be higher in urban areas, while the further dyslipidemia types were most frequent in rural areas. Dyslipidemia was more often seen among women in both areas of residence. Association between overweight, obesity, central obesity and diabetes was observed with dyslipidemia. The need to enhance intervention programs to manage dyslipidemia and risk factors should establish priorities.

Figure 1: Prevalence of dyslipidemia according to area of residence among the study population.

Figure 2: Prevalence of dyslipidemia by different age groups and sex among the study population.

Figure 3: Prevalence of dyslipidemia according to sex in rural and urban residences among the study population.

Figure 4 a-e: Age- and sex-specific prevalence of dyslipidemia components in the study.

